Figure 4.
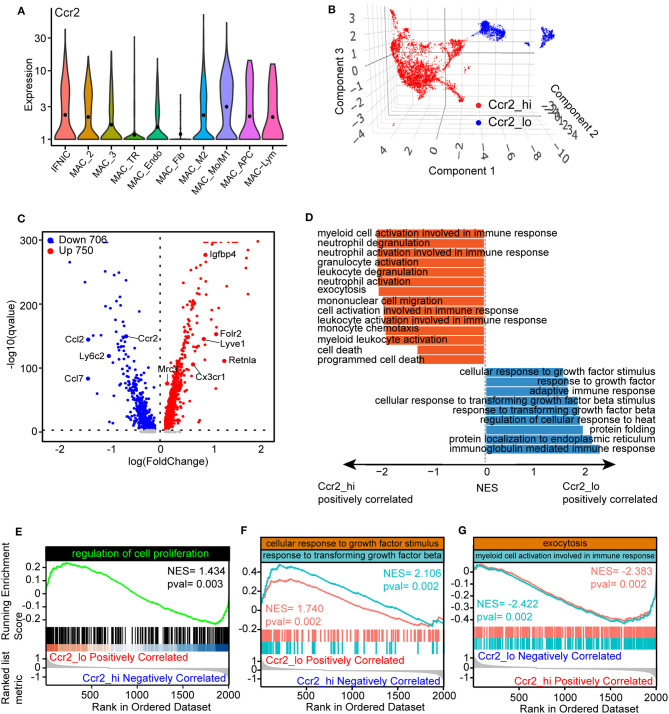
Divergent function of tissue-resident (TR) and blood-derived macrophages. (A) Violin plots showing the expression of Ccr2 in macrophage clusters. (B) 3D UMAP plot with reassigned cell identities according to the level of Ccr2 in the macrophage populations. Specifically, MAC_TR, MAC_Endo, and MAC_Fib were renamed as Ccr2_lo, whereas others were denoted as Ccr2_hi. (C) Volcano plots comparing differentially expressed genes between Ccr2_lo and Ccr2_hi clusters, with each dot representing one gene. (D) Gene set enrichment analysis (GSEA) of differentially expressed genes between Ccr2_lo and Ccr2_hi clusters using ClusterProfiler. The results were displayed as normalized enrichment score (NES) between Ccr2_lo and Ccr2_hi group. (E–G) Visualization of gene sets including the regulation of cell proliferation (E), cellular responses to growth factor stimulation and response to transforming growth factor-β (TGF-β) (F), and exocytosis and myeloid cell activation involved in immune responses (G) comparing Ccr2_lo macrophages with Ccr2_hi clusters.

