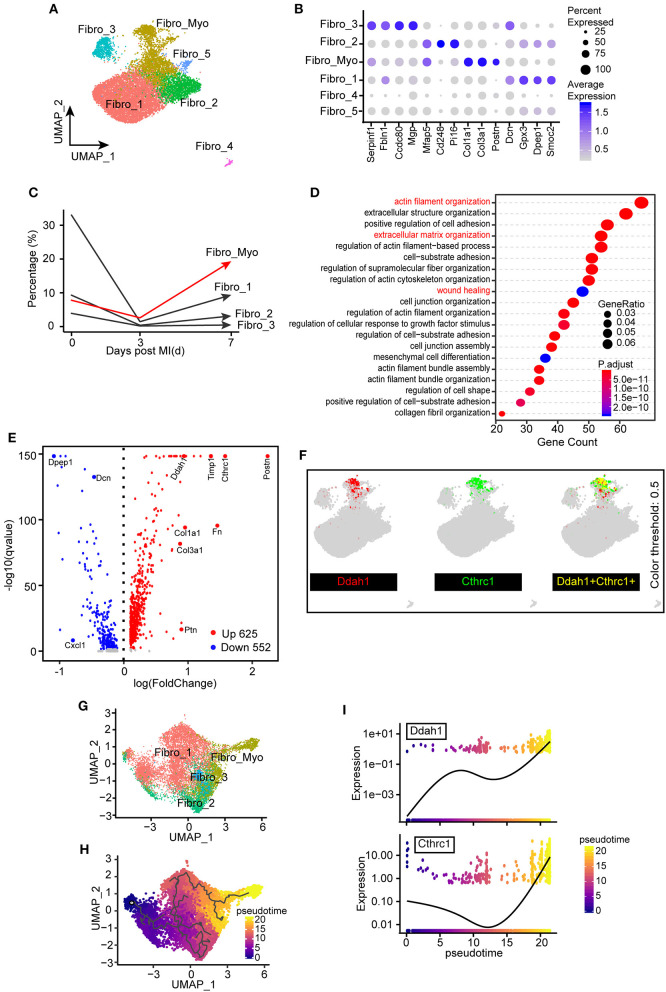
Figure 5.
Identification of the distinct transcriptional diversity of myofibroblasts in ischemic responses. (A) Subclustering of fibroblast (FB) populations for the next analysis. UMAP plot including all cell clusters with different colors. (B) Dot plot of selected marker genes corresponding to their cell identity. The dot size and scale colored represented the percentage of expressed genes and the mean expression of each cell population, respectively. (C) Percentages of different FB clusters (Fibro_Myo, Fibro_1, Fibro_2, and Fibro_3) at 0, 3, and 7 days after myocardial infarction (MI) surgery. (D) Hallmark gene ontology (GO) analysis between myofibroblasts (Fibro_Myo) and all other clusters based on biological process terms. (E) Volcano plot of differentially expressed genes between myofibroblasts and others clusters. The red dots indicated upregulated genes, whereas the blue dots indicated decreased genes. (F) UMAP plots showing the coexpression of myofibroblast marker genes (Ddah1, Cthrc1) in all FB populations. (G) Repartitioning of all FBs based on the Monocle algorithm. (H) Pseudotime trajectory analysis of all FBs according to highly variable genes. UMAP plot showing pseudotime score from dark to light yellow, representing the early to terminal transition. (I) Pseudotime expression of Ddah1 and Cthrc1, indicating their continuously upregulated expression during the healing process.

