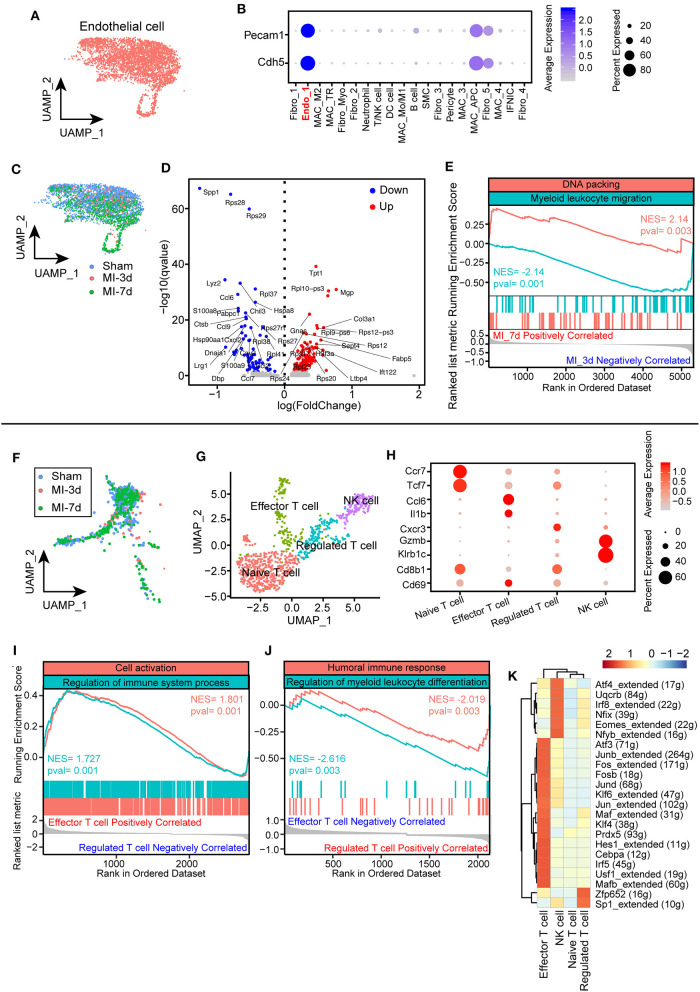
Figure 7.
Characterization of endothelial cells (ECs) and T cells after myocardial infarction (MI). (A) UMAP plots of ECs in this study selected from all integrated cells. (B) Dot plot showing exclusively expressed marker genes (Pecam1 and Cdh5) in ECs across all the identified cell populations. (C) UMAP plot showing the distribution of ECs in sham group, 3, 7 days after MI. (D) Volcano plot showing differentially expressed genes of ECs at 7 days after MI compared with ECs at 3 days. (E) Hallmark GSEA analysis of differentially expressed genes 7 days after MI compared with cells at 3 days showing that ECs at 7 days were positively correlated with DNA packing and negatively correlated with myeloid leukocyte migration. (F) UMAP plot of T cells from integrated data in sham group, 3, 7 days after MI surgery. (G) T cells were repartitioned and renamed before further analysis and showed with the UMAP plot. (H) Dot plot with specific marker genes of T cell clusters showing heterogeneous expression of T cells. The dot size and scale color represented the percentage of expressed genes and the mean expression of each cell population, respectively. (I,J) GSEA of effector T cells with regulated T cells, indicating that effector T cells were positively correlated with cell activation and immune system processes (I) and negatively correlated with humoral immune responses and myeloid leukocyte differentiation (J). (K) Single-cell regulatory network inference and clustering (SCENIC) analysis showing distinct regulons cross T cell clusters.

