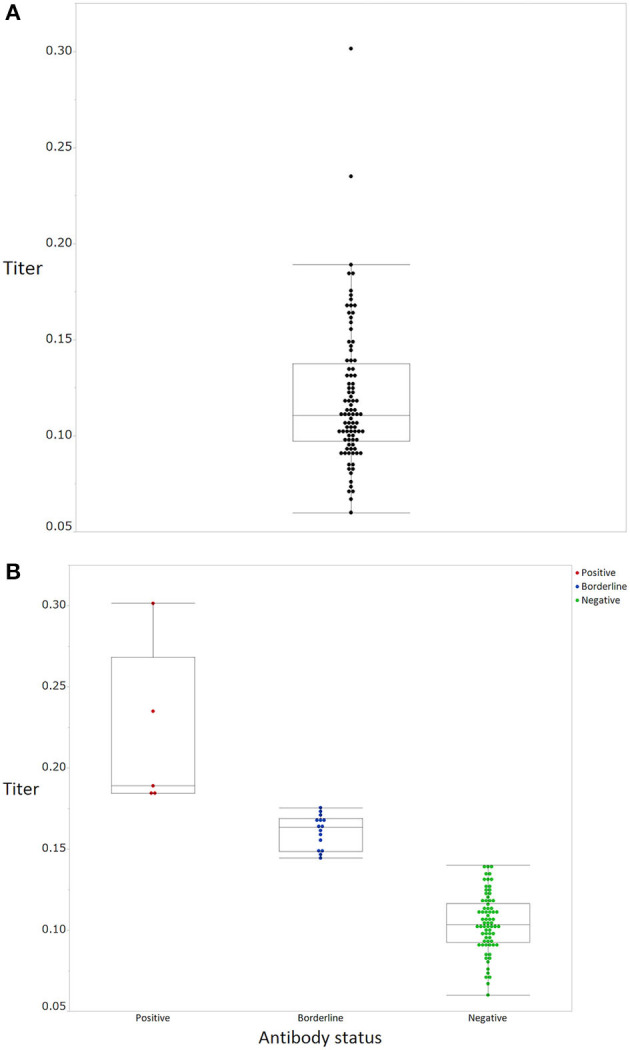
Figure 1.

SARS-CoV-2 IgG antibody titers of the participants. (A) All participants (black), (B) stratified according to positive (red), borderline (blue), and negative (green) status. Boxes correspond to the interquartile range of values for each group; error bars show the 90th percentile range.
