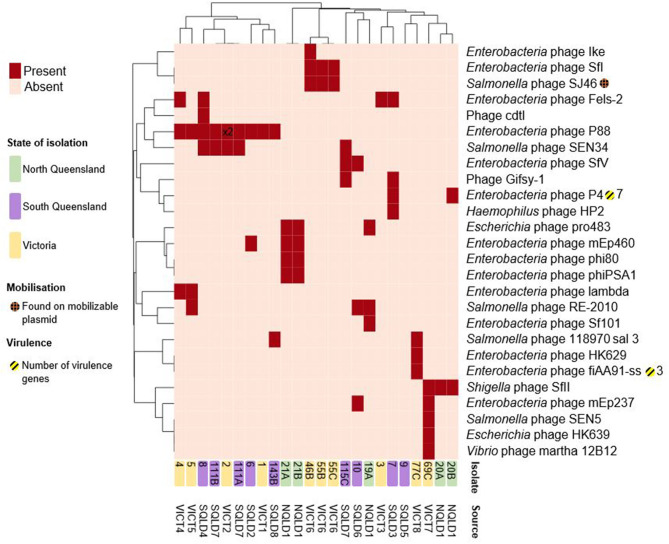
Figure 5.
Heatmap of presence/absence of putatively intact prophages within the E. coli isolates. Clusters were based on correlation between prophages (x-axis) and isolates (y-axis). Dark red rectangles show hits to -like phages. Further information including accession numbers can be found in Supplementary Data Sheet 4. Clustering shown on rows and columns using the “correlation” distance measure. Victorian isolates are colored in yellow, North Queensland in green, South Queensland in purple. Presence on a putatively mobilizable plasmid represented by orange-hashed circles. Yellow-striped circles and the corresponding number represent presence and number of putative virulence factors. Number shown on heatmap (x2) indicate multiple intact prophages within the same genome. Heatmap produced using ClustVis.

