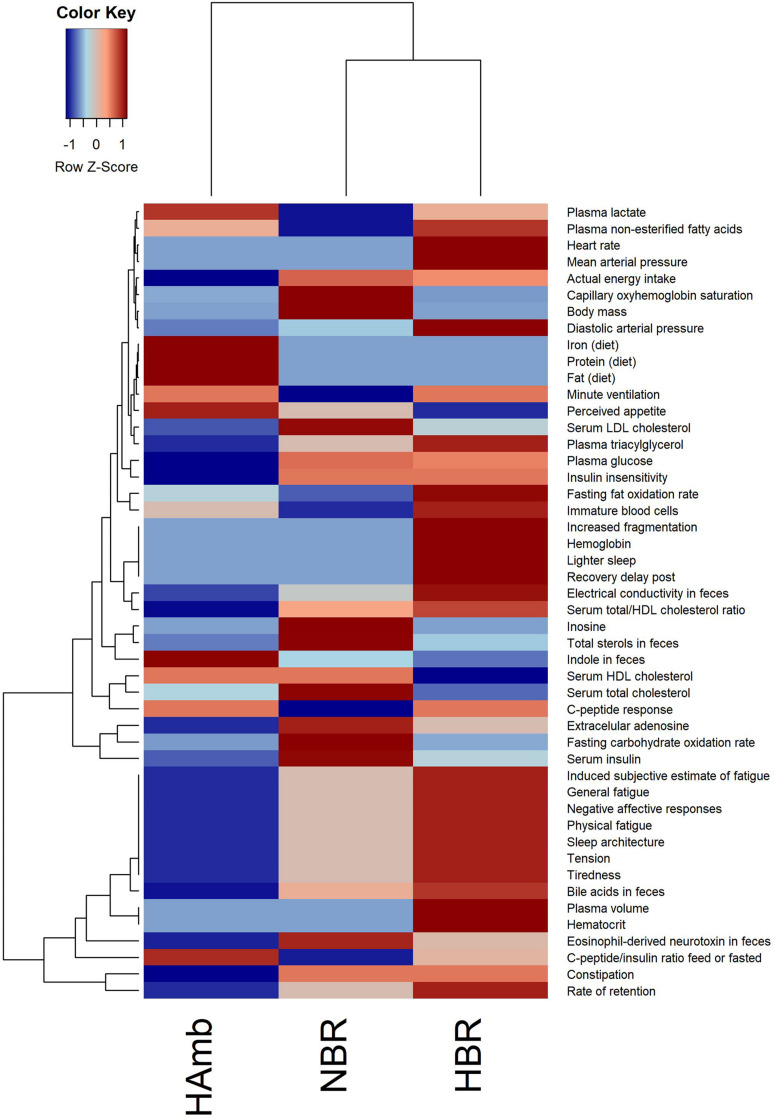
FIGURE 1.
Heatmap plot showing the relationship between parameters describing human physiology, psychology, and intestinal environment that differed significantly at the end of the PlanHab experiment (n = 48; p < 0.05; FDR corrected) that are now part of the new version of the in-house PlanHab database (Sket et al., 2017b) based on all measured variables within the project. The inset to the left represents the magnitude of z-normalized data.

