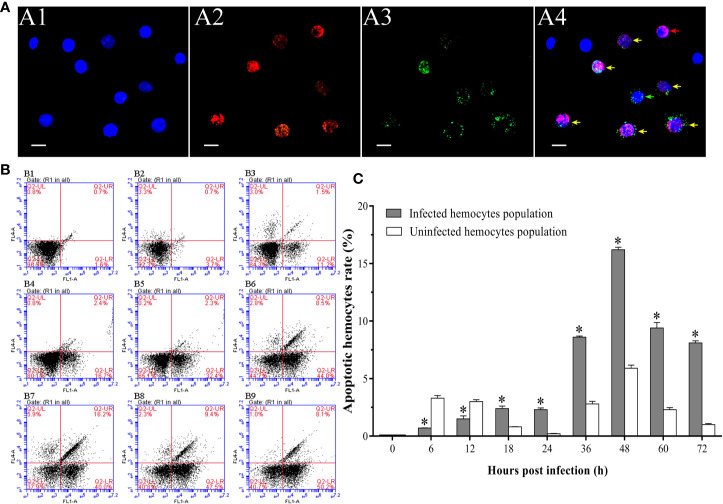
Figure 4.
Analysis of the apoptosis dynamic of WSSV-positive and WSSV-negative hemocytes by IFA and flow cytometry. (A) IFA analysis of apoptotic and/or WSSV-positive hemocytes sampled at 48 hpi. A1: DAPI stained the nucleus of hemocytes; A2: TUNEL stained apoptotic hemocytes; A3: Alexa Fluor®488 stained the WSSV-positive hemocytes; A4: The merge of A1, A2 and A3. Bars=10 μm. The yellow arrows indicate apoptotic and WSSV-infected hemocytes; the red arrows indicate apoptotic WSSV-uninfected hemocytes; the green arrows indicate non-apoptotic WSSV-infected hemocytes. (B) Representative dot plots showing apoptotic rates of WSSV-infected and WSSV-uninfected hemocytes at 0, 6, 12, 18, 24, 36, 48, 60 and 72 hpi. Q2-LL: non-apoptotic and WSSV-uninfected hemocytes; Q2-LR: non-apoptotic and WSSV-infected hemocytes; Q2-UL: apoptotic and WSSV-uninfected hemocytes; Q2-UR: apoptotic and WSSV-infected hemocytes. (C) The apoptotic rates of WSSV-infected and WSSV-uninfected hemocytes. All values are given as arithmetic mean ± S.D (n = 3). Significant differences are marked with asterisks, p < 0.05.

