FIGURE 2.
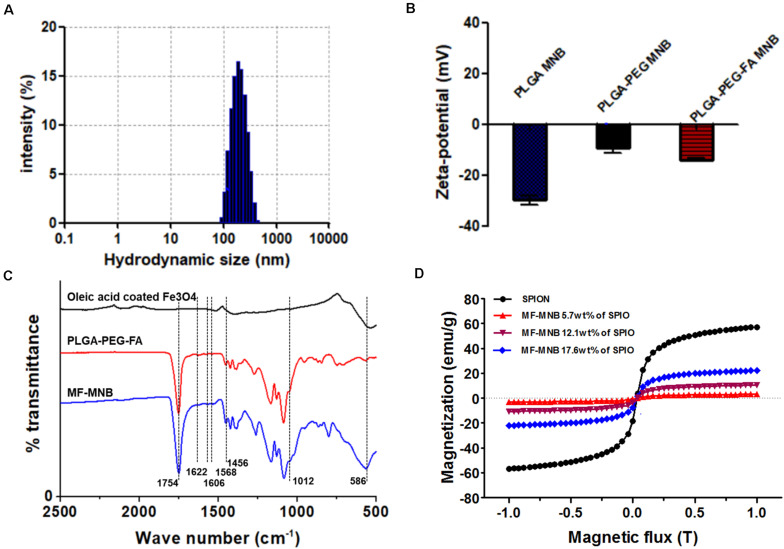
Characterization of MF-MNB. (A) Hydrodynamic size of MF-MNB in PBS solution (pH 7.4). (B) Zeta potential of PLGA MNB, PLGA-PEG MNB, and PLGA-PEG-FA MNB (MF-MNB), respectively. (C) Fourier transform infrared (FTIR) spectrum curve of SPIO, PLGA-PEG-FA polymer and MF-MNB, respectively. (D) Magnetization curve of SPIO and MF-MNB with different encapsulation concentration of SPIO.

