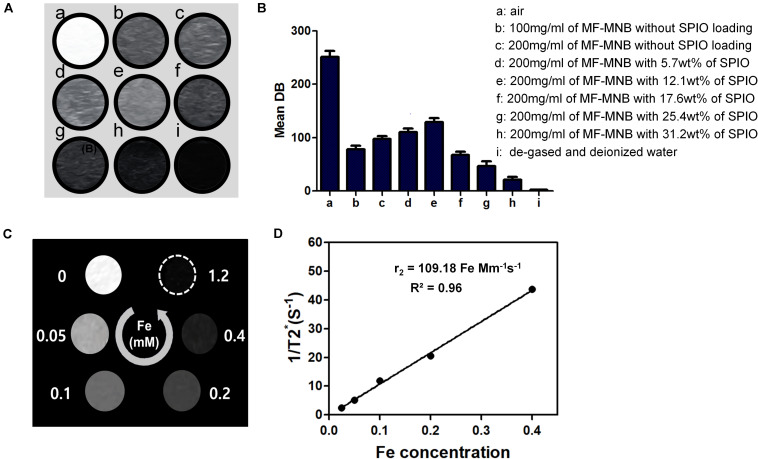
FIGURE 4.
US and MR image of MF-MNB. (A,B) US image and US signal intensity of (a) air, (b and c) 100 mg/ml and 200 mg/ml of MF-MNB without SPIO loading, (d to h) 200 mg/ml of MF-MNB with different SPIO weight percent of 5.7, 12.1, 17.6, 25.4, and 31.2, and (i) degassed and deionized water. (C) T2-weighted MR image of MF-NRS in aqueous solution at different Fe concentration. (D) Relaxation rate r2 (1/T2) of MF-NRS at different as a function of Fe concentrations.

