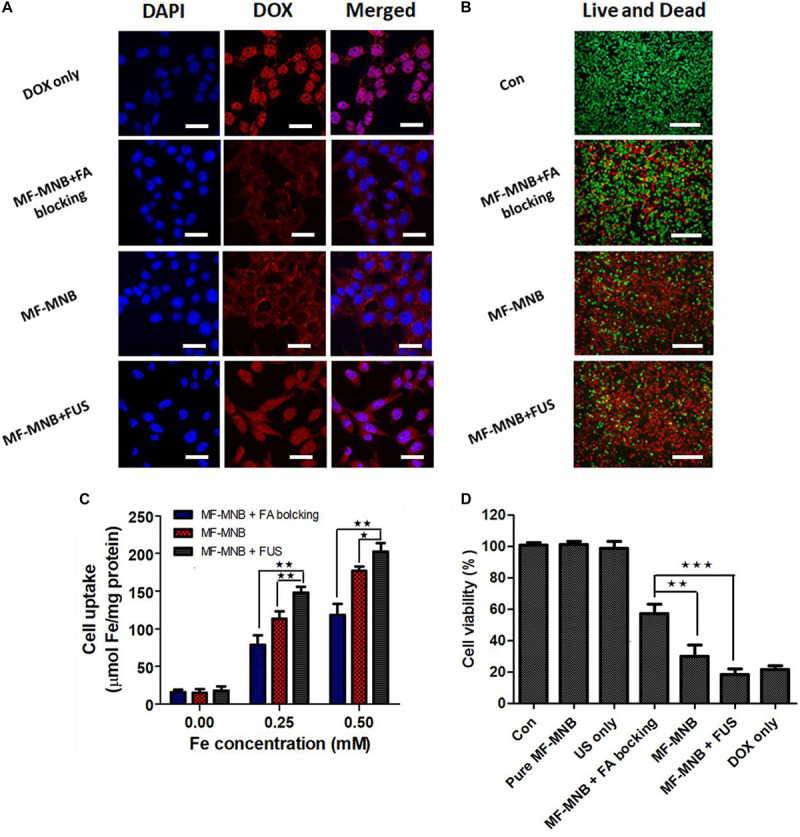
FIGURE 5.

In vitro cell test results. (A) Confocal microscopy images of live 4T1 cells treated with free DOX, MF-MNB with FA receptor blocking, MF-MNB, and MF-NRS with FUS sonication (blue fluorescence is associated with DAPI and the red fluorescence shows DOX). All scale bars are 30 μm. (B) Fluorescence microscopy images of live and dead 4T1 cells treated with PBS, MF-MNB with FA receptor blocking, MF-MNB, and MF-NRS with FUS sonication (green fluorescence is associated with calcein AM and the red fluorescence shows PI). All scale bars are 200 μm. (C) Quantification of iron concentration on 4T1 cells after treatment with MF-MNB with FA receptor blocking, MF-MNB, and MF-MNB with FUS sonication. (D) Viability of 4T1 cells after incubation for 24 h with the same treatment with those in the fluorescence images (*p < 0.05, **p < 0.01, ***p < 0.001).
