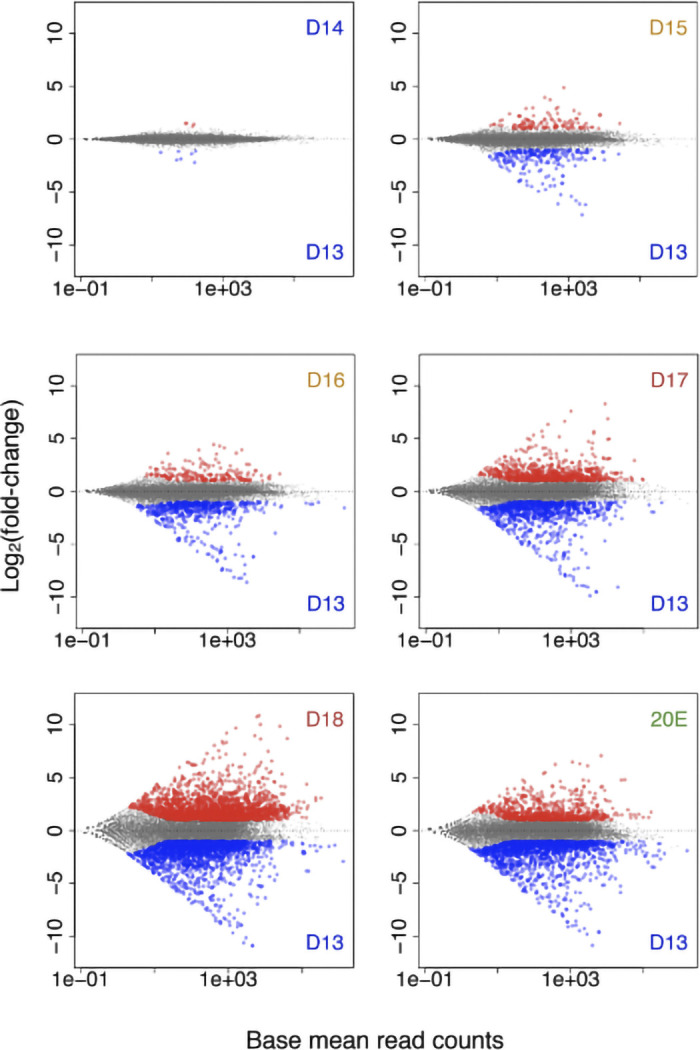
Fig. 1.

Differentially expressed genes during the intersegmental muscle (ISM) development. Scatter plots of differentially expressed genes between day 13 and the other time points during the ISM development as well as 20-hydroxyecdysone (20E)-treated animals (20E). Red dots, upregulated genes; blue dots, downregulated genes. The abundance of almost all transcripts was identical between days 13 and 14 when the muscles are homeostatic. Starting on day 15, when atrophy begins, almost twice as many genes were repressed than were induced. In contrast, when the ISMs became committed to die on day 18, more than twice as many genes were induced than were repressed. D, day; n = 3 independent libraries were analyzed for each developmental stage.
