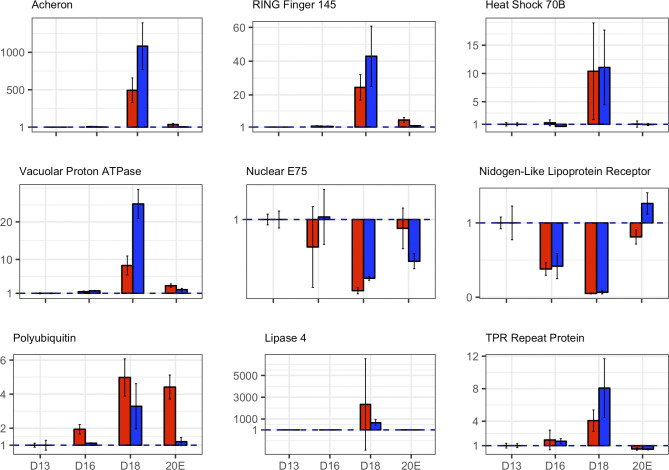
Fig. 2.
Corroboration of RNA-Seq data with quantitative PCR (qPCR). The expression levels of the nine genes that were shown to be differentially expressed during atrophy and/or death with RNA-Seq (red) were assessed for equivalence with qPCR (blue). For each day of development, three biological replicates (n = 3) were obtained, and the data were analyzed as fold-change in expression relative to day 13. RNA-Seq and qPCR measures of transcript abundance were comparable at every day of development and also in the 20-hydroxyecdysone (20E) group; the absolute fold change between qPCR and RNA-Seq were typically within 1 PCR cycle of one another. Data are means ± SE. D, day.

