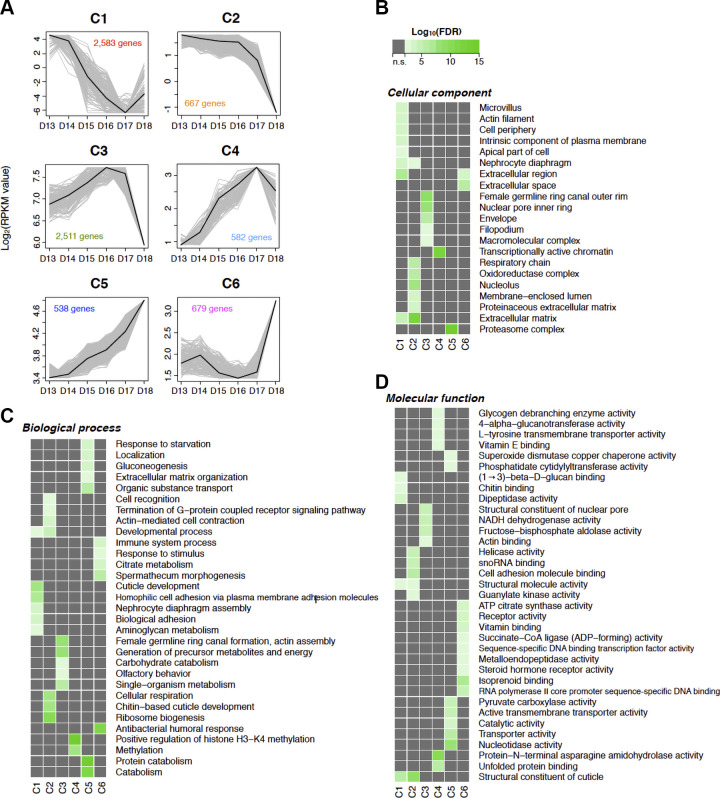
Fig. 4.
Expression and functional aspects of clustered genes. A: the patterns of differential gene expression across intersegmental muscle (ISM) development can be best explained with six distinct clusters. Black line, the center of the cluster; gray, represent 25% of the best-fitting genes. The y-axis denotes Log2 fold change (RPKM value), while the number of genes that fall within each cluster are denoted with the colored numbers within each panel. B–D: pathway enrichment among the six clusters (C1–C6). The columns represent the clusters, while the rows are the GO terms for cellular component (B), biological process (C), and molecular function (D). n = 3 independent libraries were analyzed for each developmental stage. D, day; FDR, false discovery rate.

