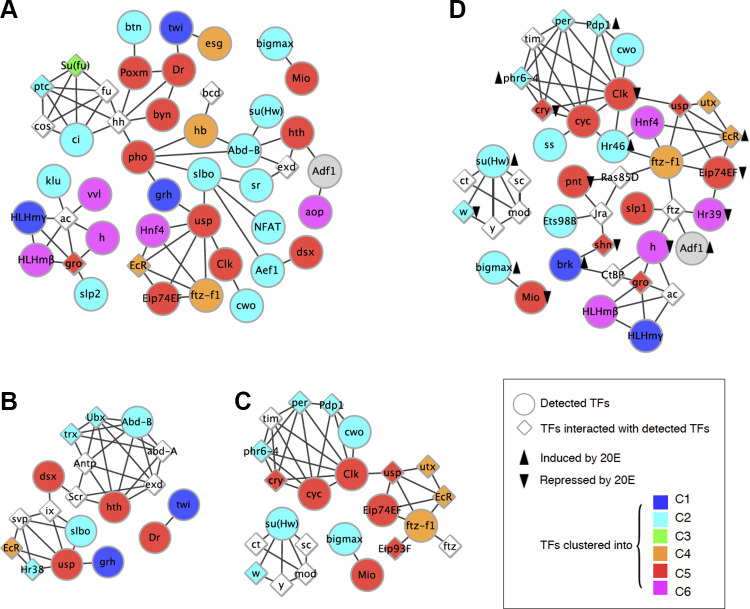
Fig. 5.
Protein-protein interaction subnetwork of transcription factors (TFs) detected in the transcription factor binding site (TFBS) enrichment analysis. Each node represents each TF detected in the TFBS enrichment analysis. Each edge indicates a protein-protein interaction between TFs. The colors of the nodes show the gene clusters that the TFs belong to. The other TFs interacting with the detected TFs are also shown. A: TFBSs enriched in gene clusters and the expression of the TFs. B: TFBSs uniquely enriched in cluster 2 (C2) and the expression of the TFs. C: TFBSs uniquely enriched in C5 and the expression of the TFs. D: TFBSs uniquely enriched in repressed genes by 20-hydroxyecdysone (20E) and the expression of the TFs. Black arrows indicate upregulation or downregulation by 20E. Enhancer of split mgamma protein, a target of Notch signaling, was enriched for genes in cluster 6 (C6). The TFBSs of Hairy/h and Stripe/sr were enriched in the genes in C4. Five TFBSs, GFI-1B, Cubitus interruptus/ci), Hunchback/hb, Klumpfuss/klu, and jim, were enriched for genes in C3. Two TF subnetworks were detected for C2 genes: homeobox genes (Abd-B and Homothorax/hth) and ecdysone receptor signaling (Ultraspiracle/usp).

