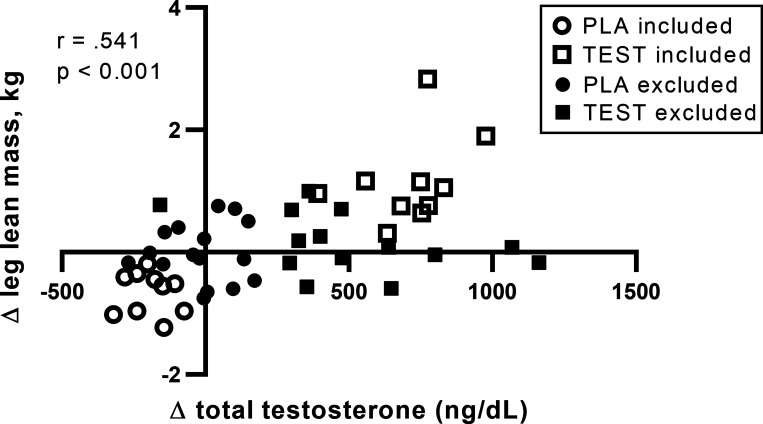
Fig. 2.
Participant stratification according to leg lean mass and total testosterone. Changes in leg lean mass (kg) and total testosterone (ng/dL) were positively associated for all 50 participants. A subset of individuals exhibiting marked increases (TEST, n = 10) or decreases (PLA, n = 10) in both leg lean mass and total testosterone were included in all analyses.

