
Fig. 3.
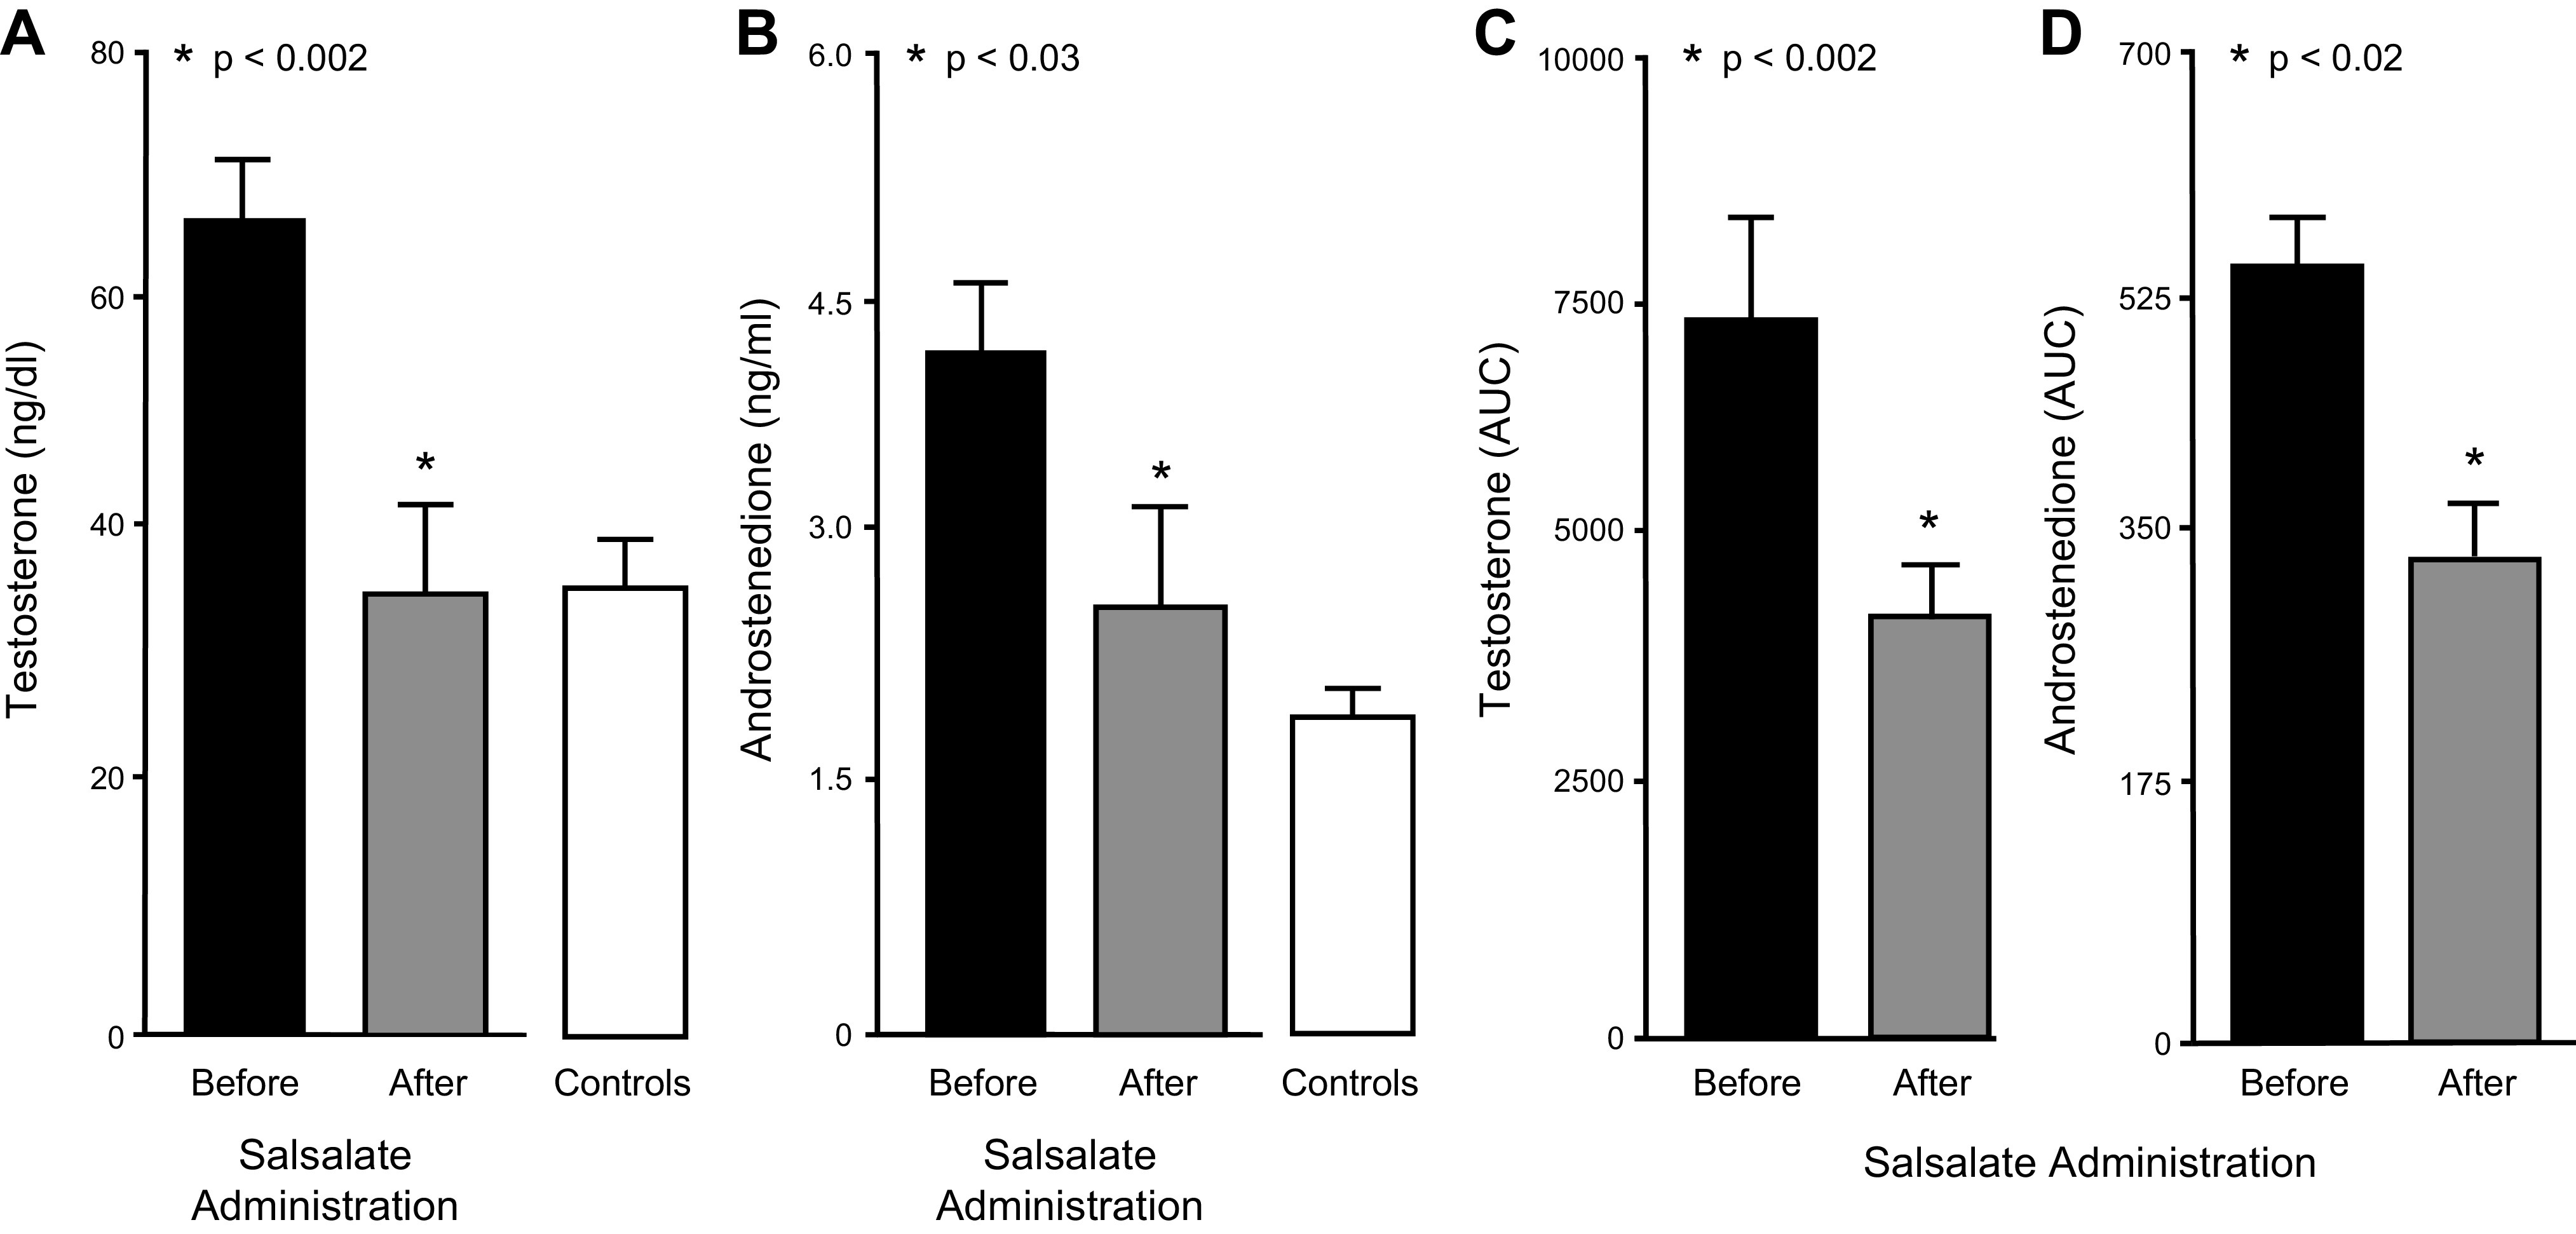
Basal levels of testosterone (A) and androstenedione (B) in women with polycystic ovary syndrome (PCOS) before and after salsalate treatment (n = 8) and in control subjects (n = 8) at baseline. Area under the curve (AUC) for human chorionic gonadotropin (HCG)-stimulated testosterone (C) and androstenedione (D) secretion in women with PCOS before and after salsalate treatment. *Significantly decreased after treatment (paired Student’s t test); P < 0.002 (A) and (C), P < 0.03 (B), and P < 0.02 (D).