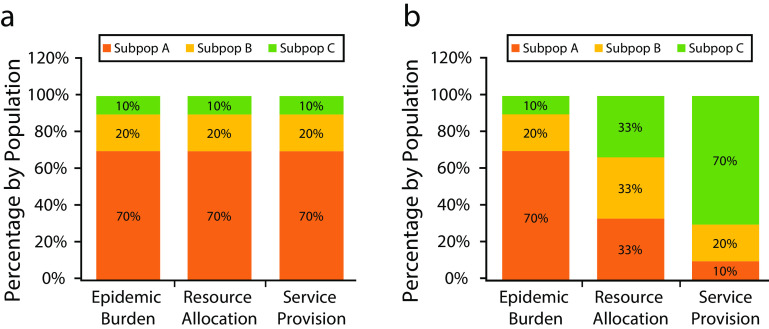
FIGURE 1—
Percentage of Hypothetical Subpopulations by (a) The Equity in Epidemic Allocations (EqEA) Framework and (b) an Example of Allocative Misalignment
Note. The figure shows proportions of hypothetical subpopulations A, B, and C across infectious disease epidemic burden, resource allocation, and service provision domains.

