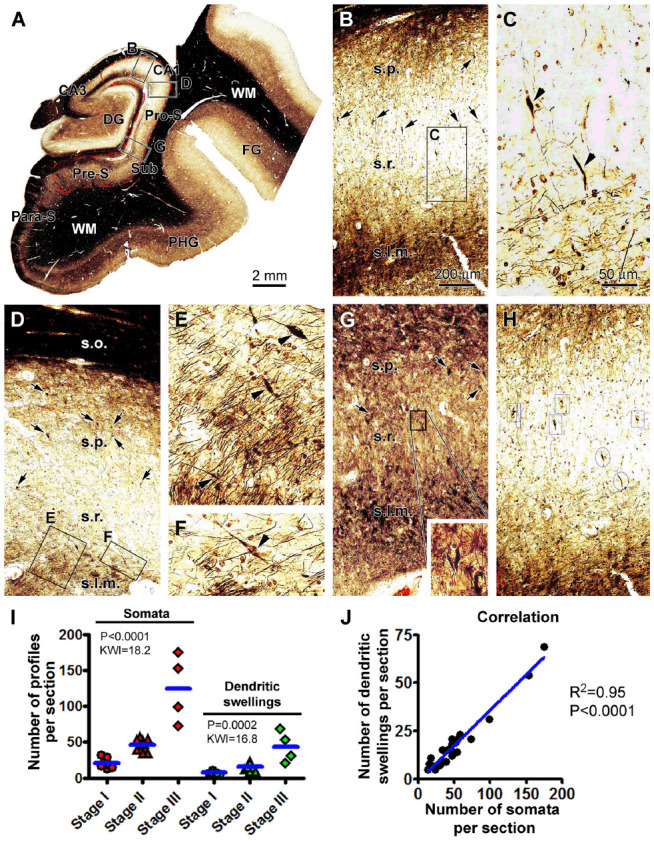
Figure 3.

Quantification of silver-stained neuronal somata and dystrophic dendrites of the hippocampal CA1 and subicular pyramidal neurons relative to the Braak stages in the PART cases. (A) Case #12 in Table 1: low-magnification micrograph illustrating the subregions of the hippocampal formation, with the region marked with the red broken line defined as the area of interest (AOI) for the correlated quantification, including the CA1 and the subicular regions surrounding the dentate gyrus (DG). The framed areas in the panels are enlarged as indicated to illustrate the closer views of labeled neuronal somata and dendritic swellings (B–G). (H) Portion of a screen print image to illustrate the taggling of silver-stained somata (framed) and dendritic swellings (circled) in the Motic scan imaging interface. (I) Numbers of silver-stained somata and dendritic swellings obtained within the AOI among the individual cases grouped based on the Braak stages. (J) Graph of Pearson correlation analysis. The results of the statistical test (Kruskal–Wallis nonparametric analysis) and correlation analysis are provided in these graphs. The abbreviations are as defined in Figures 1, 2. Scale bars are as indicated.
