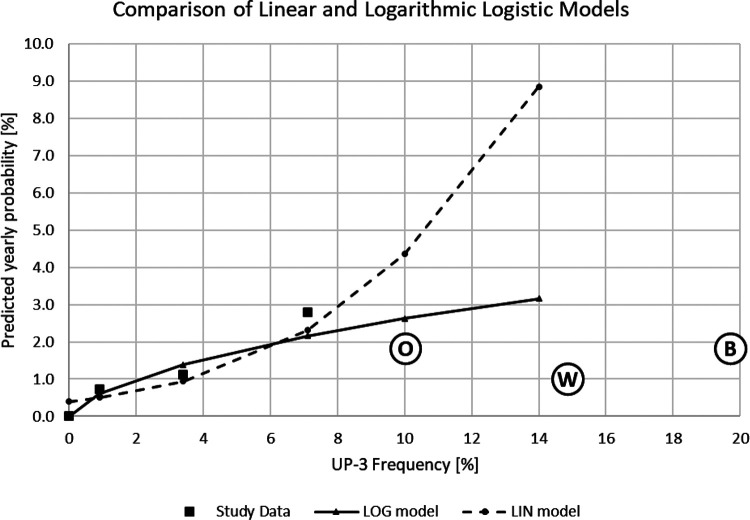
Figure 2.
Comparison between predicted probabilities of the linear (equation (1)) and logarithmic (equation (2)) logistic regression models. x-axis: frequency (%) of TWA-8 samples above 3 ppb (above 5 ppb for Ott et al. (2000) and Weill et al. (1981)) without respiratory protection (UP-3-frequency); y-axis: models: predicted yearly probability (%) of asthma consistent with being induced by TDI; study data: incidence rate per hundred person-years. The circled letters represent data from other studies: B = Bugler et al. (1991); O = Ott et al. (2000); W = Weill et al. (1981).

