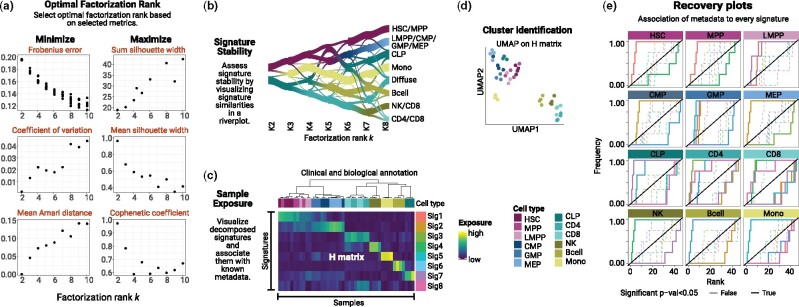
Figure 2.
example of a ShinyButchR analysis based on RNA-seq data of 12 blood cell populations and 45 samples (Corces et al., 2016). (a) NMF decomposition quality metrics plot. (b) Signature stability and hierarchy assessment by a riverplot representation of the extracted signatures at different factorization ranks. The nodes represent the signatures, the edge strength encodes cosine similarity between signatures linked by the edges. (c) Heatmap representation of the exposure matrix H showing the associated annotation features. (d) Cluster identification by running UMAP on the matrix H. (e) Recovery plot analysis to identify enrichment of known biological variables to the NMF signatures, a significant enrichment relationship is shown in a bold line.

