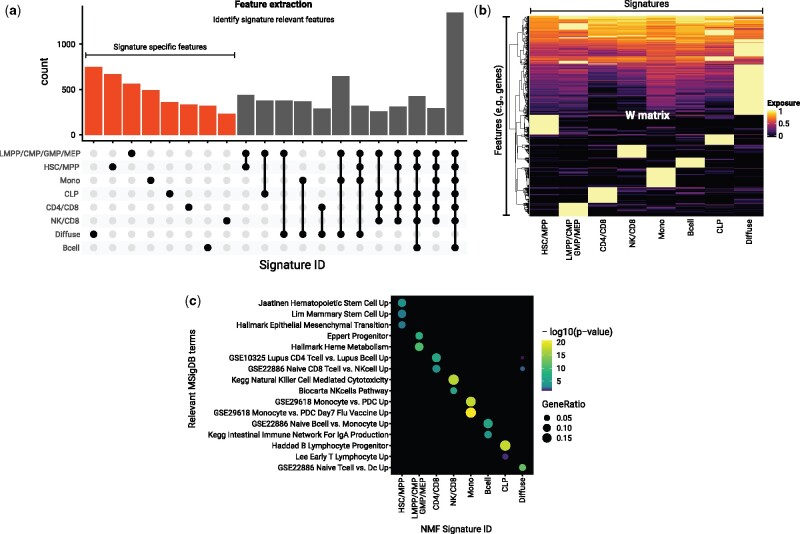
Figure 3.
feature extraction and enrichment analysis of signature associated features. (a) Extraction of features associated with the NMF signatures using the R package ButchR. The UpSet plot shows the number of genes that are classified as “Signature-specific features” (i.e., features that mainly contribute towards only one signature) and features that are associated with more than one signature. (b) Feature exposure to the matrix W of the top 10% Signature specific features. The exposure values are normalized row by row. (c) Gene set enrichment analysis using the same set of genes displayed in (b). -log10 of the corrected p-values are shown for representative gene set collections.

