Fig. 3.
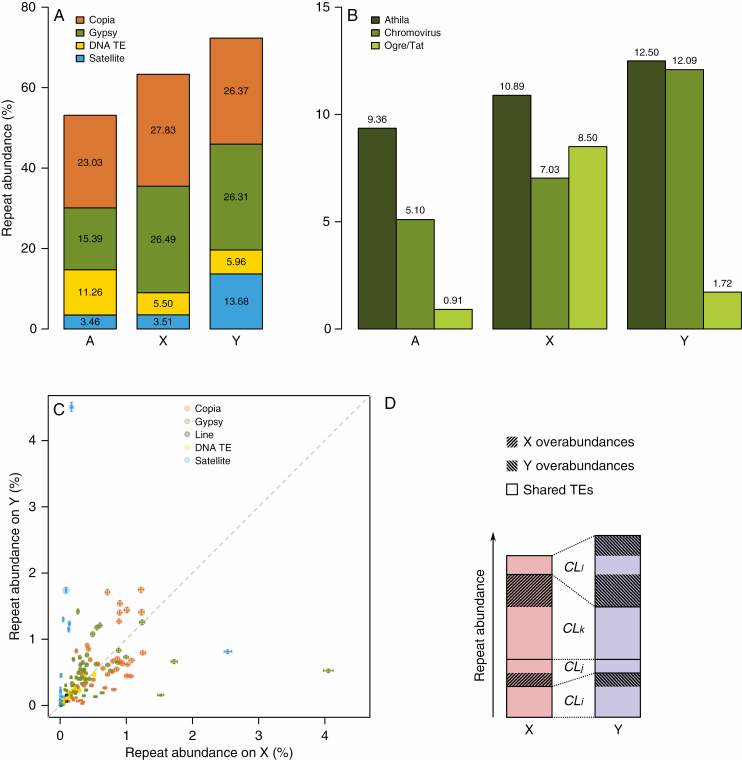
Analysis of repeat composition of R. acetosa genome and sex chromosomes. (A) Composition of repeats on X and Y chromosomes and autosomes of R. acetosa estimated from Illumina sequencing data. (B) Abundance of subfamilies of Gypsy-like transposable elements on X and Y chromosomes and autosomes. (C) Relative abundances of annotated clusters on X versus Y chromosome. Error bars represent technical 95 % confidence intervals assuming binomial distribution of reads into clusters. Area of each circle is proportional to given cluster portion in male genome. Dashed line indicates a theoretical situation where the amplification rate of a repeat family (cluster) is equal on X and Y chromosomes. (D) Graphical representation of how the overabundances in Table 3 are calculated. Numbers i, j, etc. are integers. Each cluster (CLi, CLj, ...) is either more abundant on X or on Y. If the difference is only due to technical error the excess should be generally small compared with total cluster abundance. We added the excess for all clusters from a given transposon group separately for each chromosome and named these sums X and Y overabundances. They can be compared with total transposon group abundances in Table 3.

