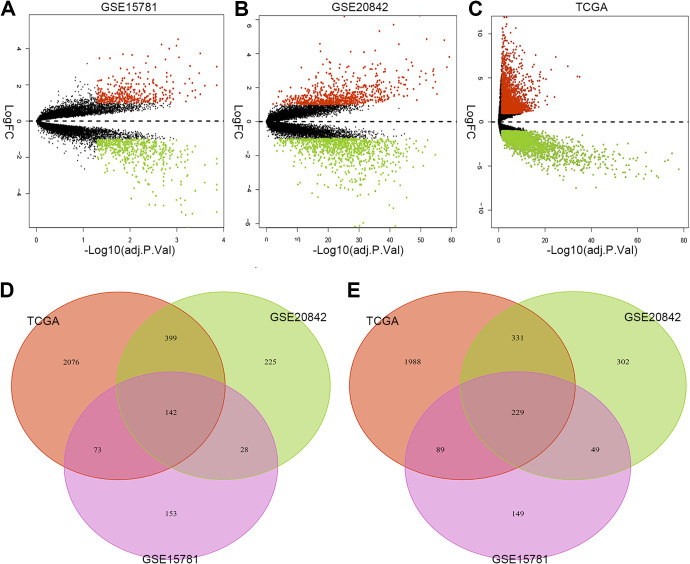
Figure 1.
Volcano plots and Venn diagrams of the common DEGs identified in profiling datasets. Notes: Volcano plots of the common DEGs according to the value of P < 0.05 and |logFC| ≥ 1 between normal rectal tissue and cancer tissue in (A) GSE15781, (B) GSE20842 and (C) TCGA databanks are showed. Red or green dots indicate upregulated or downregulated genes in profiling datasets. Venn diagrams of DEGs between normal rectal tissue and cancer tissue samples among 3 datasets are showed. The (D) upregulated and (E) downregulated genes in the 3 datasets are marked respectively. Abbreviations: DEG, differentially expressed genes. Y-axis shows the fold-change in gene expression between normal rectal tissue and cancer tissue, x-axis shows the statistical significance of the differences.

