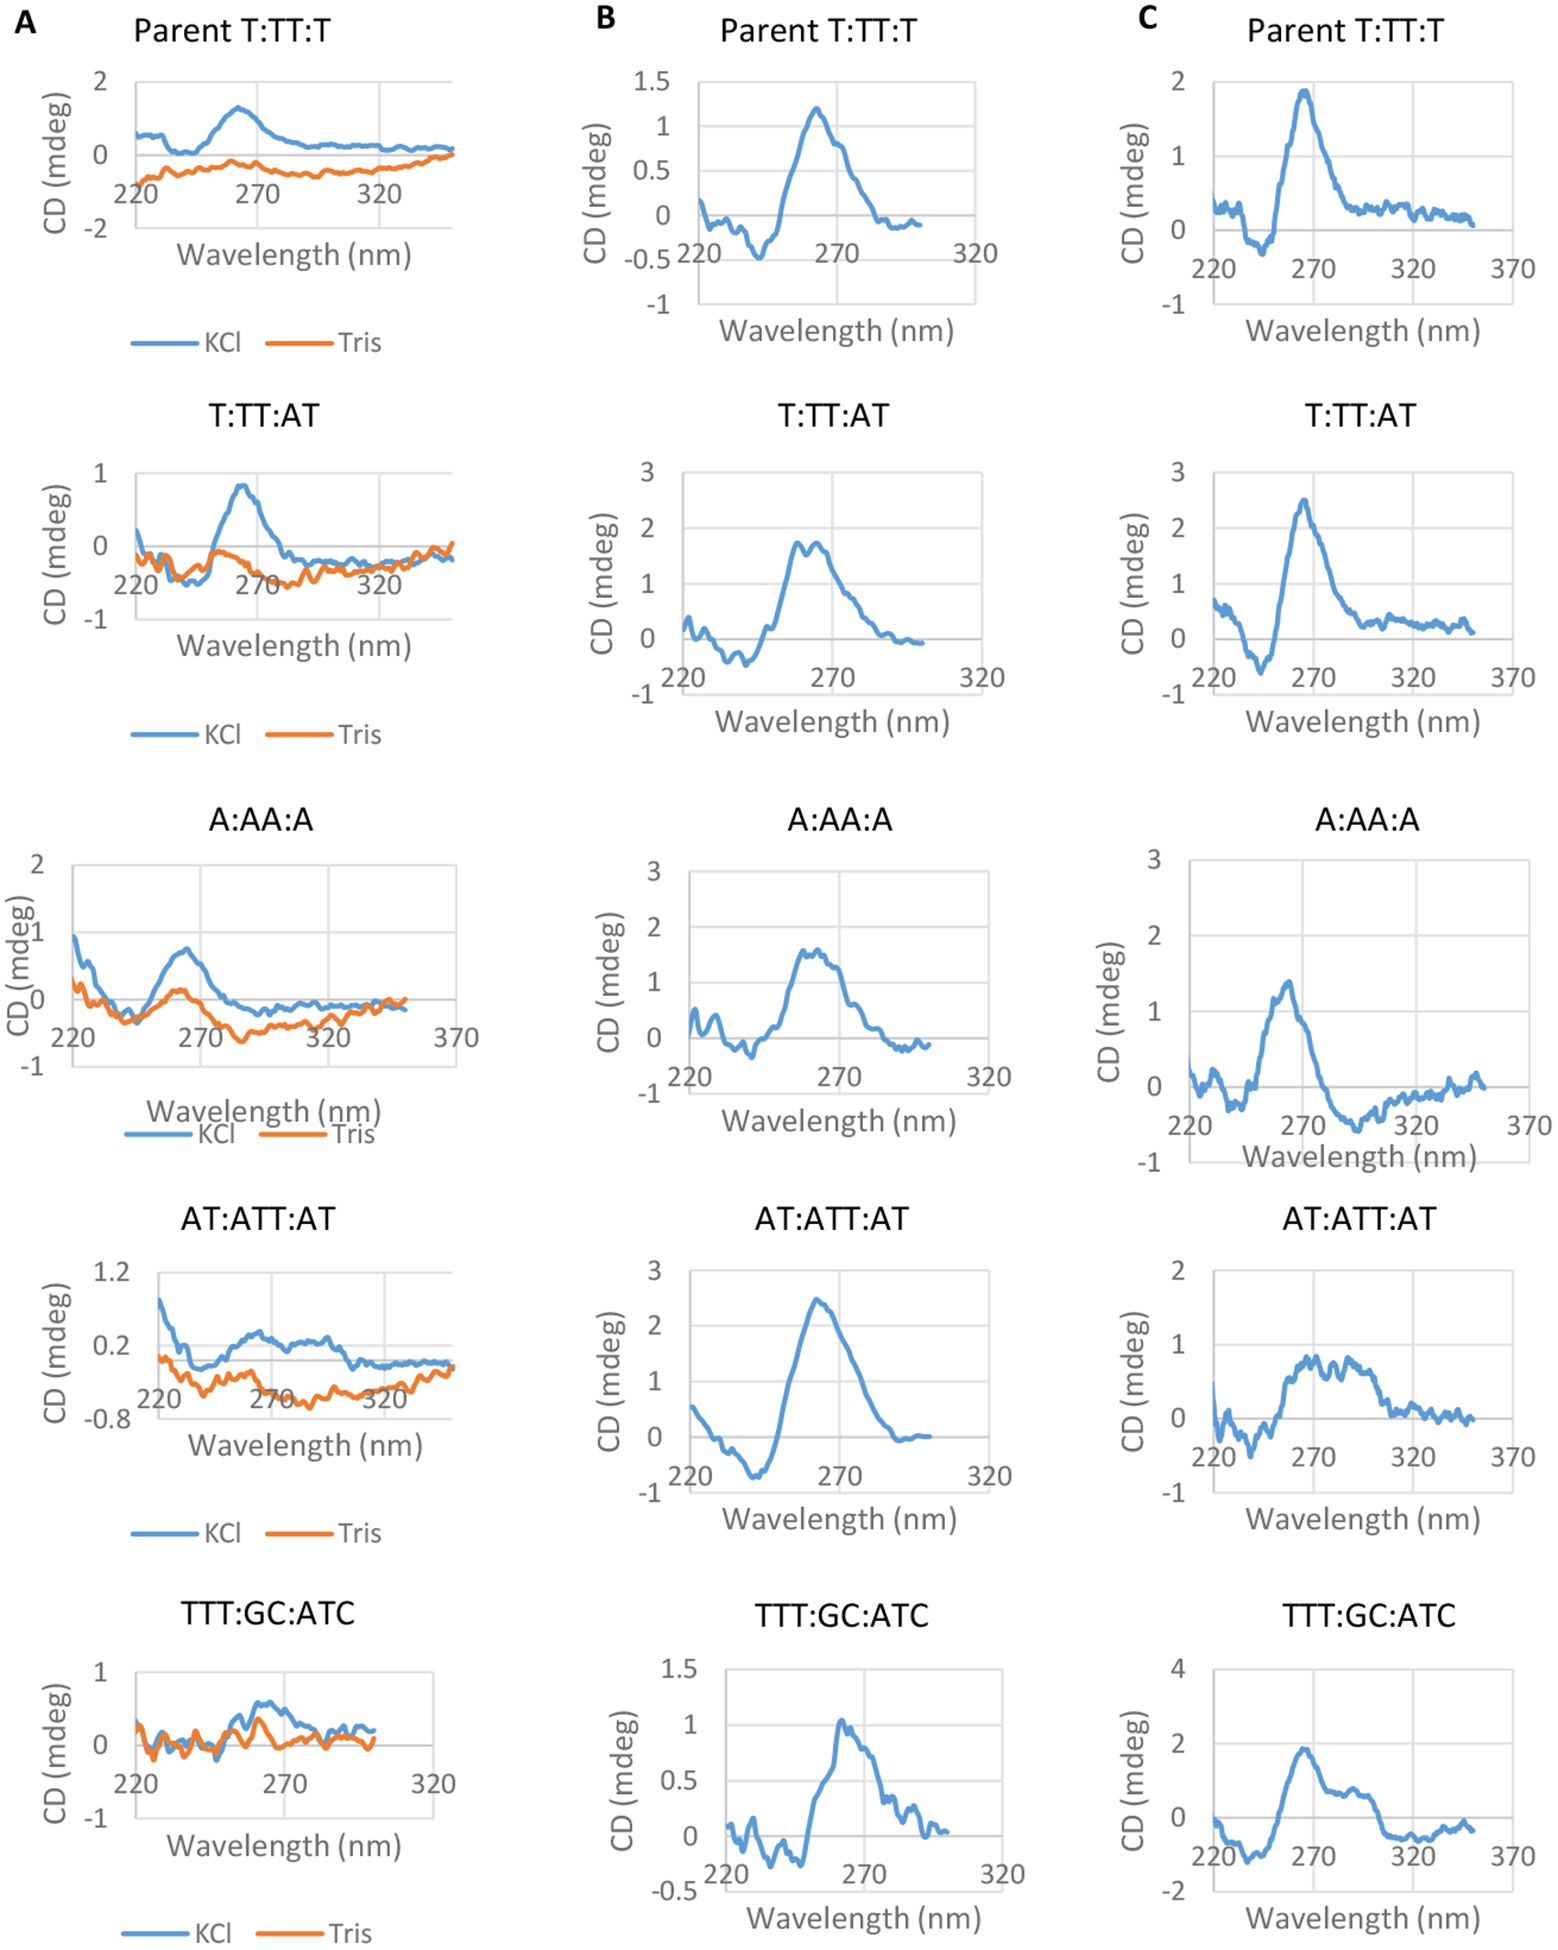
Figure 3:

Conformation of G4 structures determined by CD spectroscopy
A. The CD spectra for each FAM labeled G4 structure after folding in 100 mM Tris and 100 KCl are shown. The CD spectrum of a single stranded oligonucleotide is shown for comparison (orange traces). CD Spectra were determined in triplicate for each oligonucleotide and one representative image is shown (mdeg=millidegree).
B. CD spectra of each FAM labeled oligonucleotide after folding in the presence of 50% ethanol and 100 mM KCl and 100 mM Tris. G4 structure was measured in duplicate and one representative spectra is shown.
C. CD spectra of each oligonucleotide with a Biotin label is shown. G4 structure was measured in duplicate and one representative spectra is shown.
