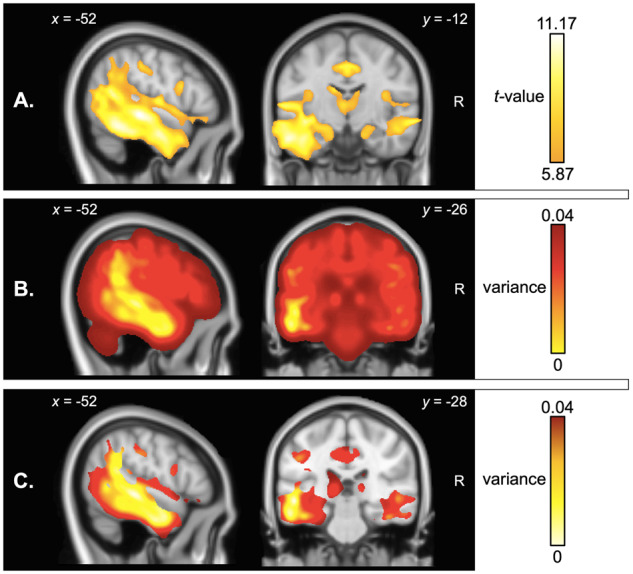
Figure 4.

VBM analyses of whole-brain atrophy. Panels indicate (A) regions of significant grey and white matter intensity reduction in LPA compared to Controls, (B) voxel-wise variance in grey and white matter intensity in LPA compared to Controls and (C) voxel-wise variance in regions of peak atrophy (computed within a mask of regions emerging from the atrophy analysis in A. Coloured voxels in A indicate regions that emerged significant in the VBM analyses at P < 0.01 corrected for Family-Wise Error with a cluster threshold of 100 contiguous voxels. Age and total intracranial volume were included as covariates in all analyses. Clusters are overlaid on the MNI standard brain with x and y co-ordinates reported in MNI standard space. LPA = logopenic progressive aphasia; R = right.
