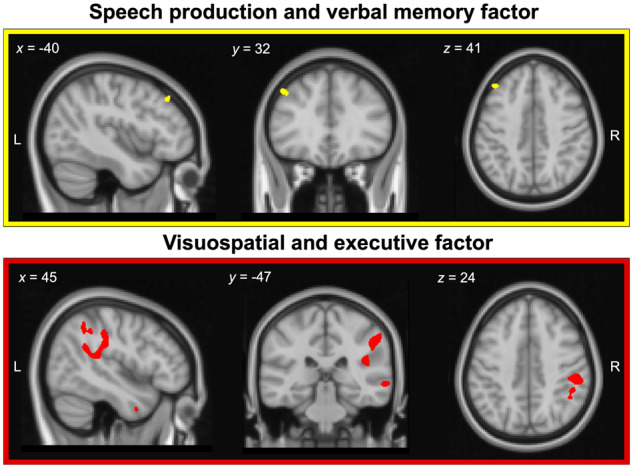
Figure 5.

Regions of grey and white matter intensity that uniquely correlate with factor scores on the speech production and verbal memory factor (i.e. Factor 1; upper panel) and visuospatial and executive factor (i.e. Factor 2; lower panel) in LPA patients. Both factors were derived from varimax-rotated PCA of neuropsychological test performance in the LPA group. Coloured voxels indicate regions that emerged significant in the VBM analyses at a threshold of P < 0.001 uncorrected for multiple comparisons with a cluster threshold of 100 contiguous voxels. All clusters reported at t = 4.09 for speech production and verbal memory factor and t ≥ 3.6 for visuospatial and executive factor. Age and total intracranial volume were included as covariates in the analyses. Clusters are overlaid on the MNI standard brain with x, y and z co-ordinates reported in MNI standard space. L = left; LPA = logopenic progressive aphasia; PCA = principal component analysis; R = right.
