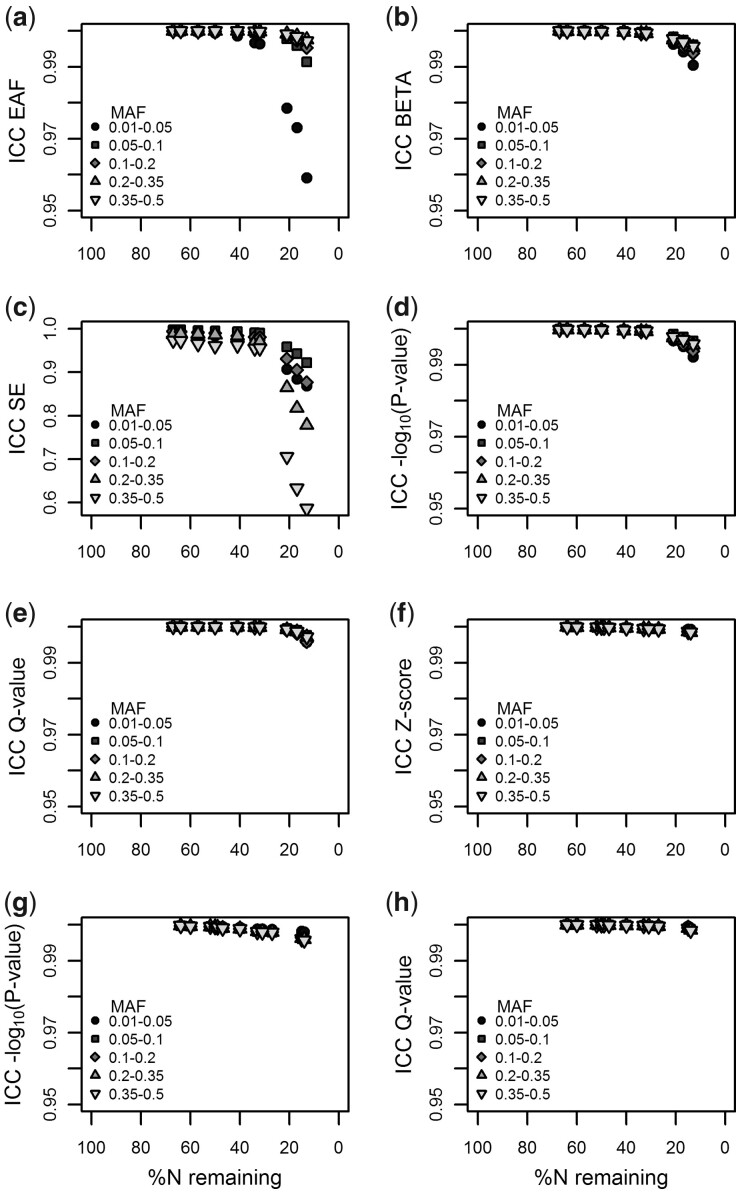
Fig. 1.
Intraclass correlation coefficients (ICCs) between the meta-GWAS results calculated with METAL and MetaSubtract for an inverse variance meta-analysis (a–e) and a sqrt(sample size) weighted z-score meta-analysis (f–h) both using double genomic control correction. The percentage of remaining samples after exclusion of 1 to 10 (a–e) or 12 (f–h) cohorts is shown on the x-axis. Different forms of the dots indicate different minor allele frequency ranges

