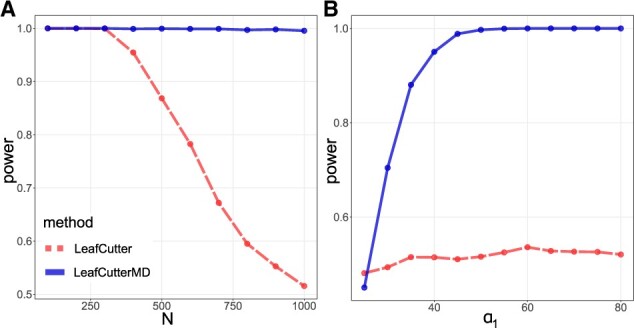
Fig. 2.

The power in the exon skipping simulation, (A) as a function of the average number of reads N, and (B) as a function of the α1 effect size, for the proposed LeafCutterMD method versus the state-of-the-art method based on the likelihood ratio test in LeafCutter
