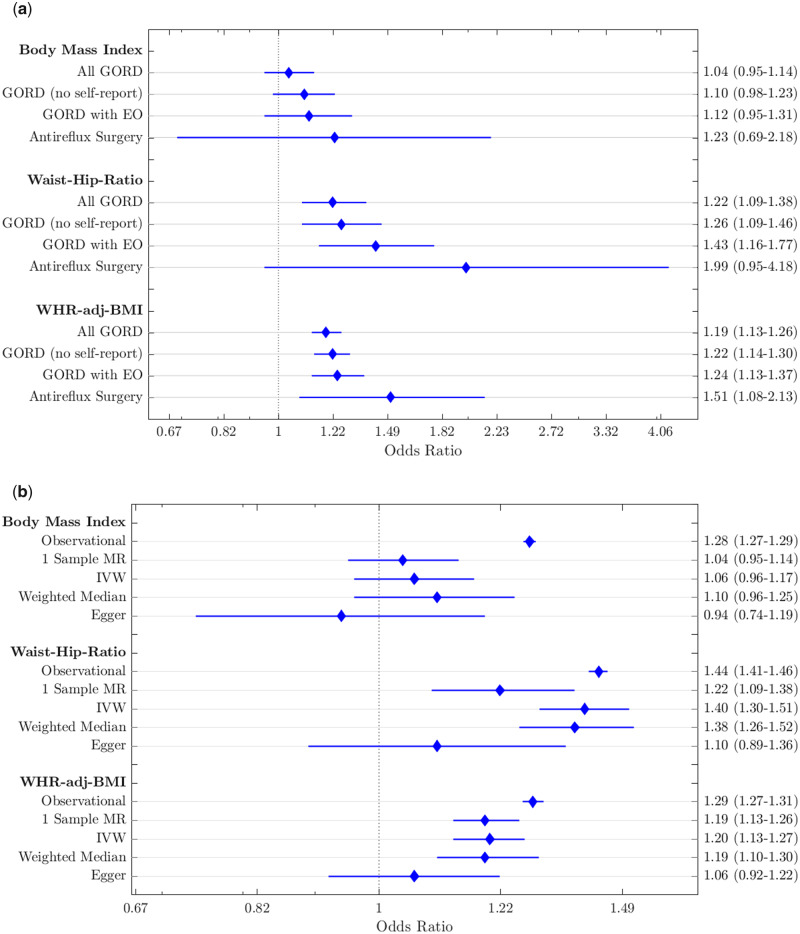
Figure 3.
Forest plots of adiposity variables.
(A) Comparison of analysis methods: showing the observational associations with gastro-oesophageal reflux disease (GORD), one-sample Mendelian randomization (MR) and two-sample MR associations (instrumental variable, weighted-median and Egger methods) for body mass index, waist–hip ratio and waist–hip ratio adjusted for body mass index in our primary analysis (all GORD). (B) Sensitivity analyses for the one-sample MR results showing similar results across all four analyses. On the right-hand axes are odds-ratio point estimates and 95% confidence intervals. All GORD, GORD (no self-report), GORD with erosive oesophagitis (EO) and Antireflux Surgery refer to primary Sensitivity Analyses 1, 2 and 3, respectively, described in Figure 2.

