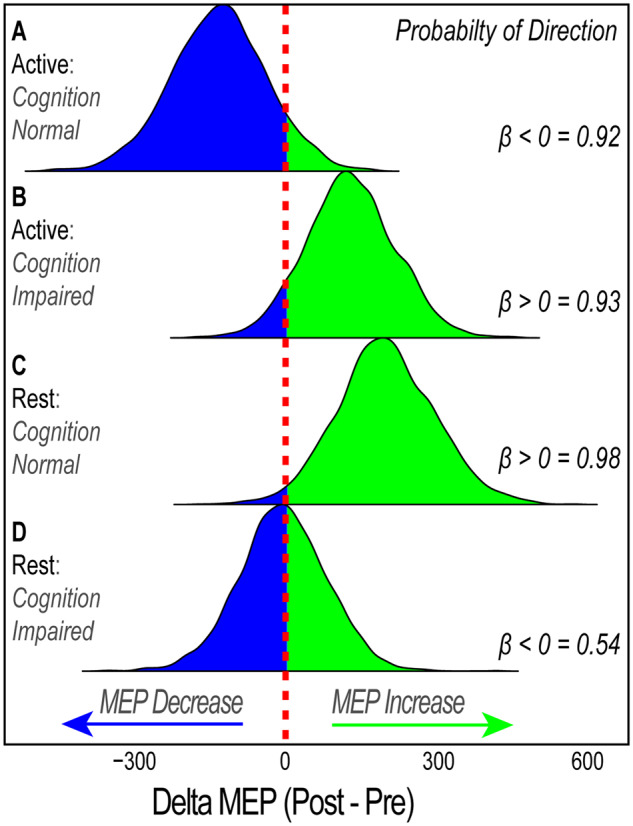
Figure 5.

Posterior distribution for possible parameter values at 140% of MT. Derived from the Bayesian analysis of normalized MEP values at 140% MT, this figure shows the probability distribution of possible parameter values for each experimental cohort. The probability of direction value represents the probability mass of the posterior distribution that falls above or below zero, representing a predicted increase or decrease, respectively, in MEP values. Values of 0.5 indicate 50% chance of increase or decrease, whereas value of 1.0 indicates 100% probability of a specified direction. This figure shows that iTBS results in: (A) 92% probability that MEP will decrease in cognitively normal individuals when preceding synaptic activation history is high (apparent homoeostatic interference), (B) 93% probability that MEP will increase cognitively impaired individuals when preceding synaptic activation history is high (diminished homoeostatic metaplasticity), (C) 98% MEP will increase in cognitively normal individuals when preceding synaptic activation history is unaltered (strong LTP-like response), (D) ∼50% probability that MEP will either increase or decrease (weaker LTP-like response) in cognitively impaired individuals when preceding synaptic activation history is unaltered
