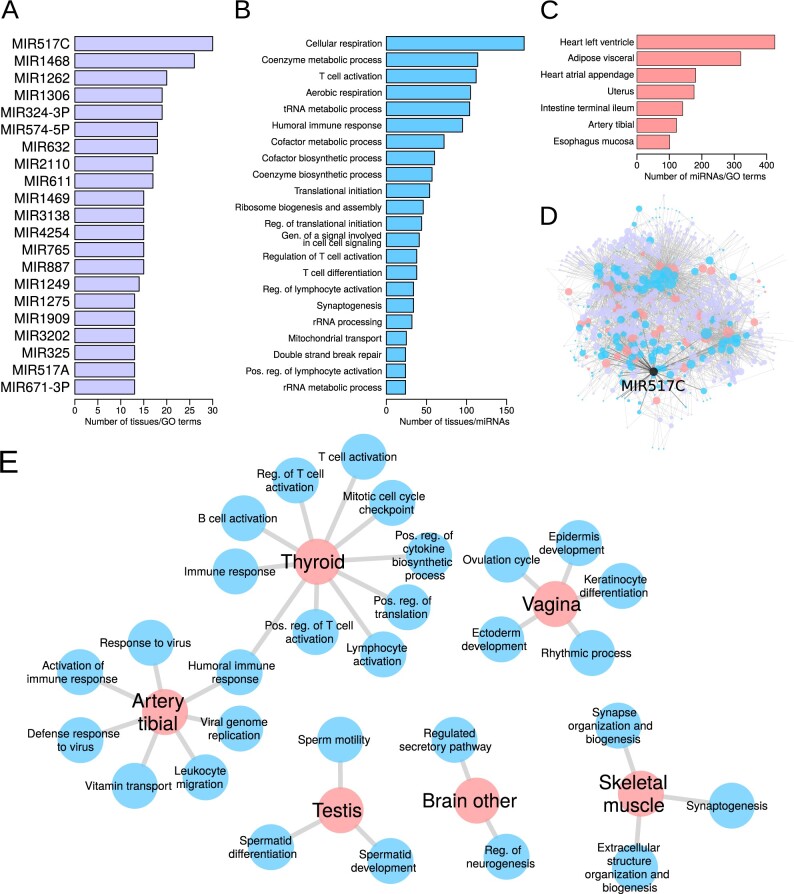
Fig. 5.
Over-represented miRNAs (A), GO terms (B) and tissues (C) in the database of significant tissue-specific functions of miRNAs. (D) Visual representation of the significant tissue-specific regulatory functions of miRNAs present in the Shiny database. Node color illustrates tissues (peach), GO terms (cyan) and miRNAs (magenta). Node size corresponds to the node’s degree. MIR517C—the miRNA with the largest over-representation in tissue-specific connections—is highlighted in black. (E) Significant tissue-specific connections made by MIR517C. Gen.: generation; Pos.: positive; Reg.: regulation.

