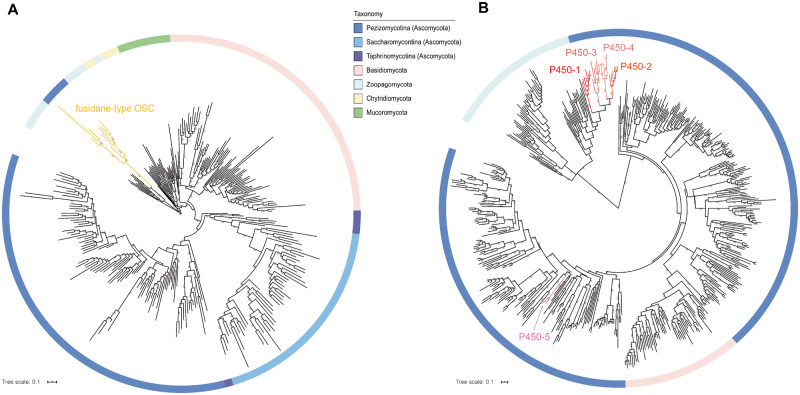
Fig. 5.
Phylogenetic trees of OSC and P50 genes in fungi. (A) ML tree of 283 OSC genes in fungi. The best evolutionary model LG+I+G4 in IQ-TREE was used to construct this tree. Each color of branches represented a fungi phylum or subphylum. The yellow branches represented fusidane-type OSC genes. (B) ML tree of 510 P450 genes in fungi. The best evolutionary model LG+F+I+G4 in IQ-TREE was used to construct this tree. The branches with five different red colors represented the fusidane-type P450-1, P450-2, P450-3, P450-4, and P450-5, respectively. The screen of OSC and P450 genes was shown in Materials and Methods in more detail. The scale of branch lengths measured in the number of substitutions per site and the numbers at nodes indicated the bootstrap support from 1,000 ultrafast bootstrap replicates.

