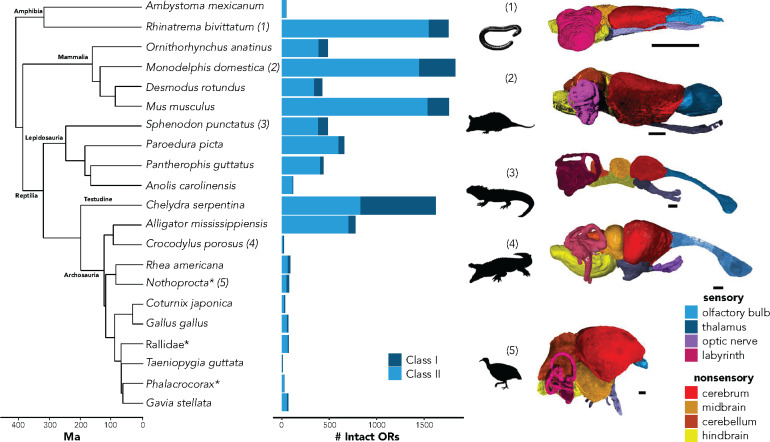
Figure 1.
Phylogeny of taxa included in this analysis with respective total intact ORs. Note this does not include all chemoreceptors, but just those within the OR Classes I and II multigene families. Numbers on the phylogeny correspond to a subset of the segmented brain and sensory regions from the soft tissue µCT-scans. Silhouettes were obtained from phylopic.org. Silhouettes and 3D reconstructions are not to scale and are enlarged for clarity. *Exact species for both genomic and phenotype data were not available. For Rallidae, G. okinawae was used for genomic data and P. carolina was used for the soft-tissue specimen. For Phalacrocorax, P. carbo was used for genomic data and P. auritus was used for the soft-tissue specimen. For Nothoprocta, N. pentlandii was used for morphology, and N. perdicaria was used for genomic data. Scale bars are 2 mm.

