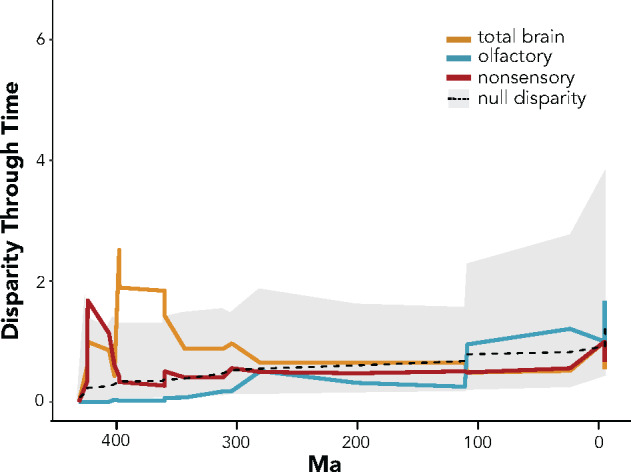
Figure 3.

Disparity of brain volumes through time. The mustard line is the volume of the entire brain and sensory regions, blue is the olfactory bulb scaled by total brain size, and red is the regions of the brain not associated with major primary sensory input: cerebrum, thalamus, midbrain, cerebellum, and medulla. The gray region of the figure is the confidence intervals from simulations modeling the total brain volume disparity as expected under Brownian motion and the dashed line is the mean value obtained from these simulations.
