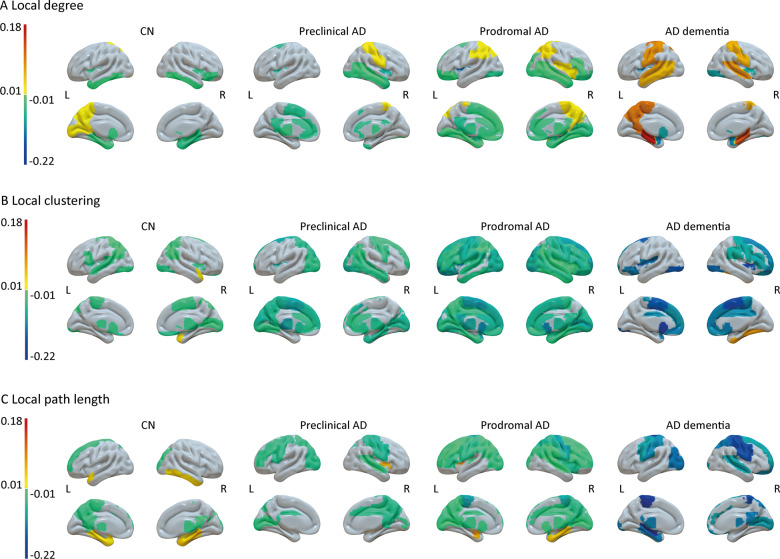
Figure 4.
Surface plots of longitudinal effects in regional network measures by baseline disease stage. Longitudinal changes in local degree (A), local clustering (B) and local path length (C) are based on estimated marginal trends as modelled with Bayesian linear mixed models. Effects were considered significant if the 95% credible interval did not cross zero. Group differences were considered significant if the 95% credible interval of the pairwise group comparison did not cross zero and effects for the respective groups were significant. For differences between baseline disease stages, see Supplementary Fig. 7. Subcortical structures are plotted in ventricular areas as approximation. L, left hemisphere; R, right hemisphere.

