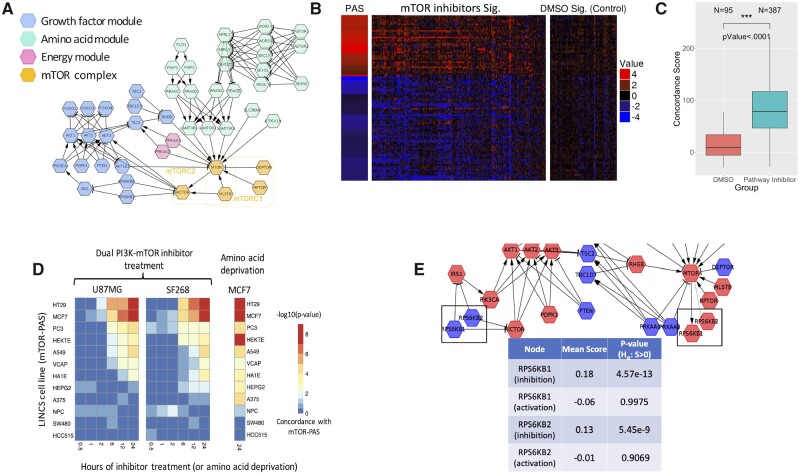
Fig. 2.
PAS of the mTOR signaling pathway. (A) mTOR signaling pathway constructed from literature consisting of four key modules; (B) PAS constructed using the methods in Figure 1 and the LINCS CP signatures for the pathway inhibitors and vehicle treatment; (C) distribution of concordance scores for pathway inhibitors and vehicle treatment; (D) statistical significance (-log10(empirical P-value)) of the concordance scores for PI3K inhibition signatures (first two heatmaps) in two glioblastoma cell lines (U87MG and SF268), and amino acid starvation (the third heatmap) in MCF7 cell line; (E) using node contribution scores to assess the role of S6K kinase in regulating mTOR pathway activity in the MCF7 PAS

