Figure 2.
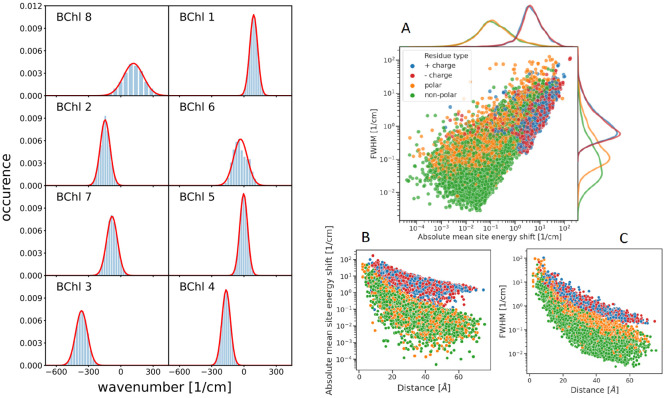
(Left) Distribution of site energy shifts ΔEm(c) = Σk ΔEm(k)(c) (eqs 3 and 4) of the eight pigments BChl m (m = 1,..., 8) in one monomeric subunit of the FMO protein, obtained by combining the FRODA MC sampling of protein conformations and the CDC method for the calculation of site energy shifts. The red lines are Gaussian functions fitted to the histograms using the parameters in Table S1. (Right) Analysis of site energy shifts ΔEm(c) (eq 4) caused by single amino acid residues k of different types (blue, positively charged; red, negatively charged; orange, polar; green, nonpolar). Panel A contains the correlation between the full width at half-maximum (fwhm) of the distribution function of ΔEm(k)(c) and the absolute mean site energy shift |⟨ΔEm(c)⟩|. The curves on top and on the right side give the respective distribution functions for the various types of amino acids. Panels B and C contain the dependence of the fwhm and the |⟨ΔEm(k)(c)⟩|, respectively, on the distance between amino acid k and pigment m.

