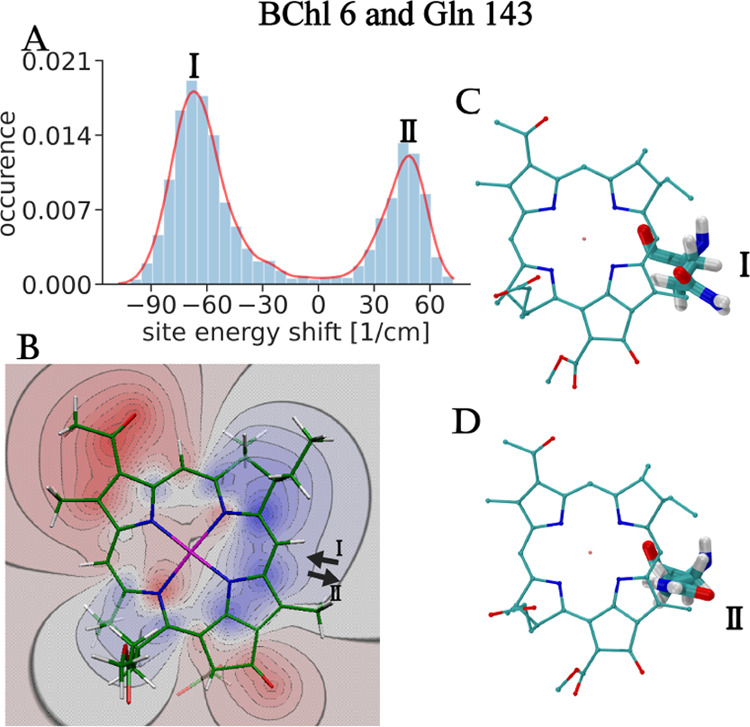
Figure 3.

Site energy shift of BChl 6 caused by protein residue Gln 143. In panel A, the distribution function of this site energy shift is shown. The red line on top of the histograms was added to guide the eye. Representative conformations of Gln 143 giving rise to the two peaks I and II of the distribution function are given in panels C and D, respectively. Panel B contains the difference electrostatic potential between the excited and ground states of BChl a obtained with TD-DFT calculations using the B3LYP XC functional. Red (blue) regions correspond to a negative (positive) difference potential. Black arrows I and II represent the dipole moment of the amide side chain of Gln 143 in conformations I and II of this residue shown in panels C and D, respectively.
