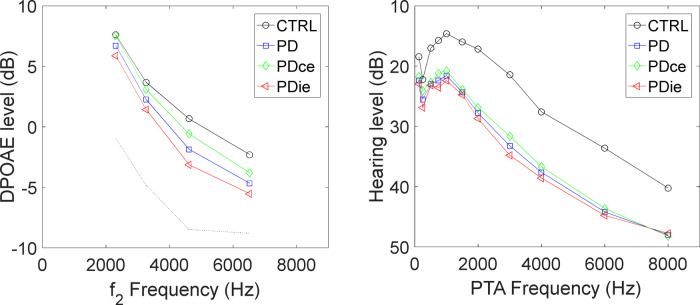
Figure 3.
DPOAE levels and PTA HLs in study subjects versus controls. Left: average zero-latency DPOAE levels, plotted against f2 frequency, in four half-octave frequency bands, for the control group (CTRL), for the Parkinson’s disease patient ears and for the two subgroups of ipsilateral and contralateral ears. Standard errors, not shown for clarity, are ∼1 dB for all groups. Right: average PTA HLs in 11 frequency bands for the control group (CTRL), for the Parkinson’s disease patient ears and for the two subgroups of ipsilateral and contralateral ears. Standard errors are ∼3 dB.

