
Figure 2.
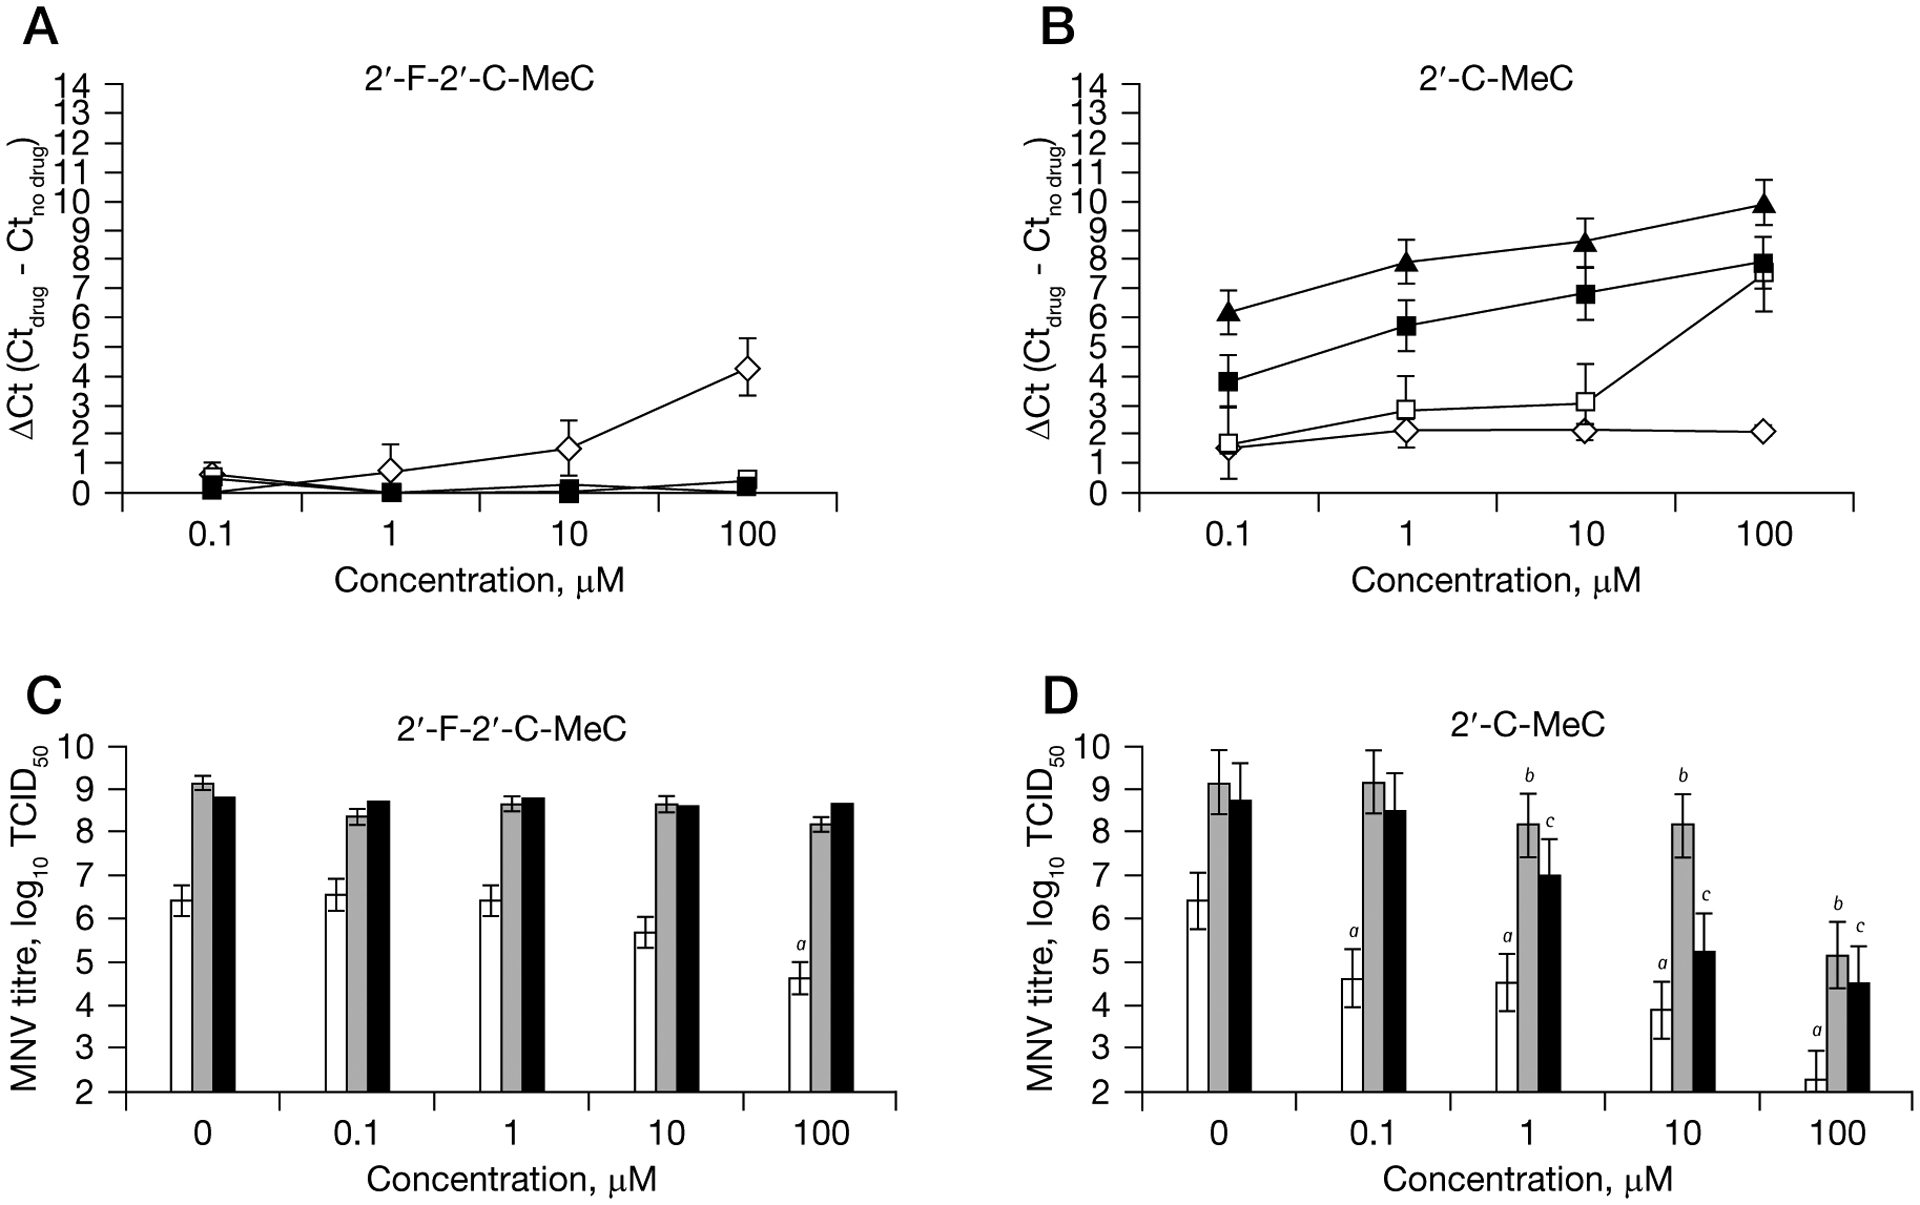
Single compound dose- and time–response curves for inhibition of MNV replication in RAW 264.7 cells
One-day-old semiconfluent RAW 264.7 cells were incubated with increasing concentrations (0.1 μM to 100 μM) of each compound for 4 h, after which the media was removed and murine norovirus (MNV) was added to the cells. Reduction of MNV RNA levels at 12 h (represented by a diamond), 24 h (represented by an open square), 48 h (represented by a black square) and 72 h (represented by a triangle) after treatment with (A) 2′-F-2′-C-MeC or (B) 2′-C-MeC were quantified by RT-qPCR. To express antiviral effectiveness, the mean Ct value of the no-drug control cells (Ctno drug) was subtracted from the mean Ct value from treated wells (Ctdrug). A ΔCt of 3.3 equals 1-log reduction in norovirus RNA levels (90% effective concentration). Each point represents the mean ± standard deviation of three independent experiments (antiviral treatment) and 3 independent RT-qPCR runs. Reduction of MNV infectivity in RAW 264.7 cells at 12 h (represented by white bars), 24 h (represented by grey bars) and 48 h (represented by black bars) after treatment with (C) 2′-F-2′-C-MeC or (D) 2′-C-MeC was measured by 50% tissue culture infectious dose (TCID50). MNV titres for cells subject to antiviral treatment that were significantly reduced (P<0.05) compared to untreated, MNV-infected cells (0 μM) are indicated a12 h; b24 h and c48 h. Each point represents the mean ± standard deviation of three replicate experiments (antiviral treatment) and three independent TCID50 assays.