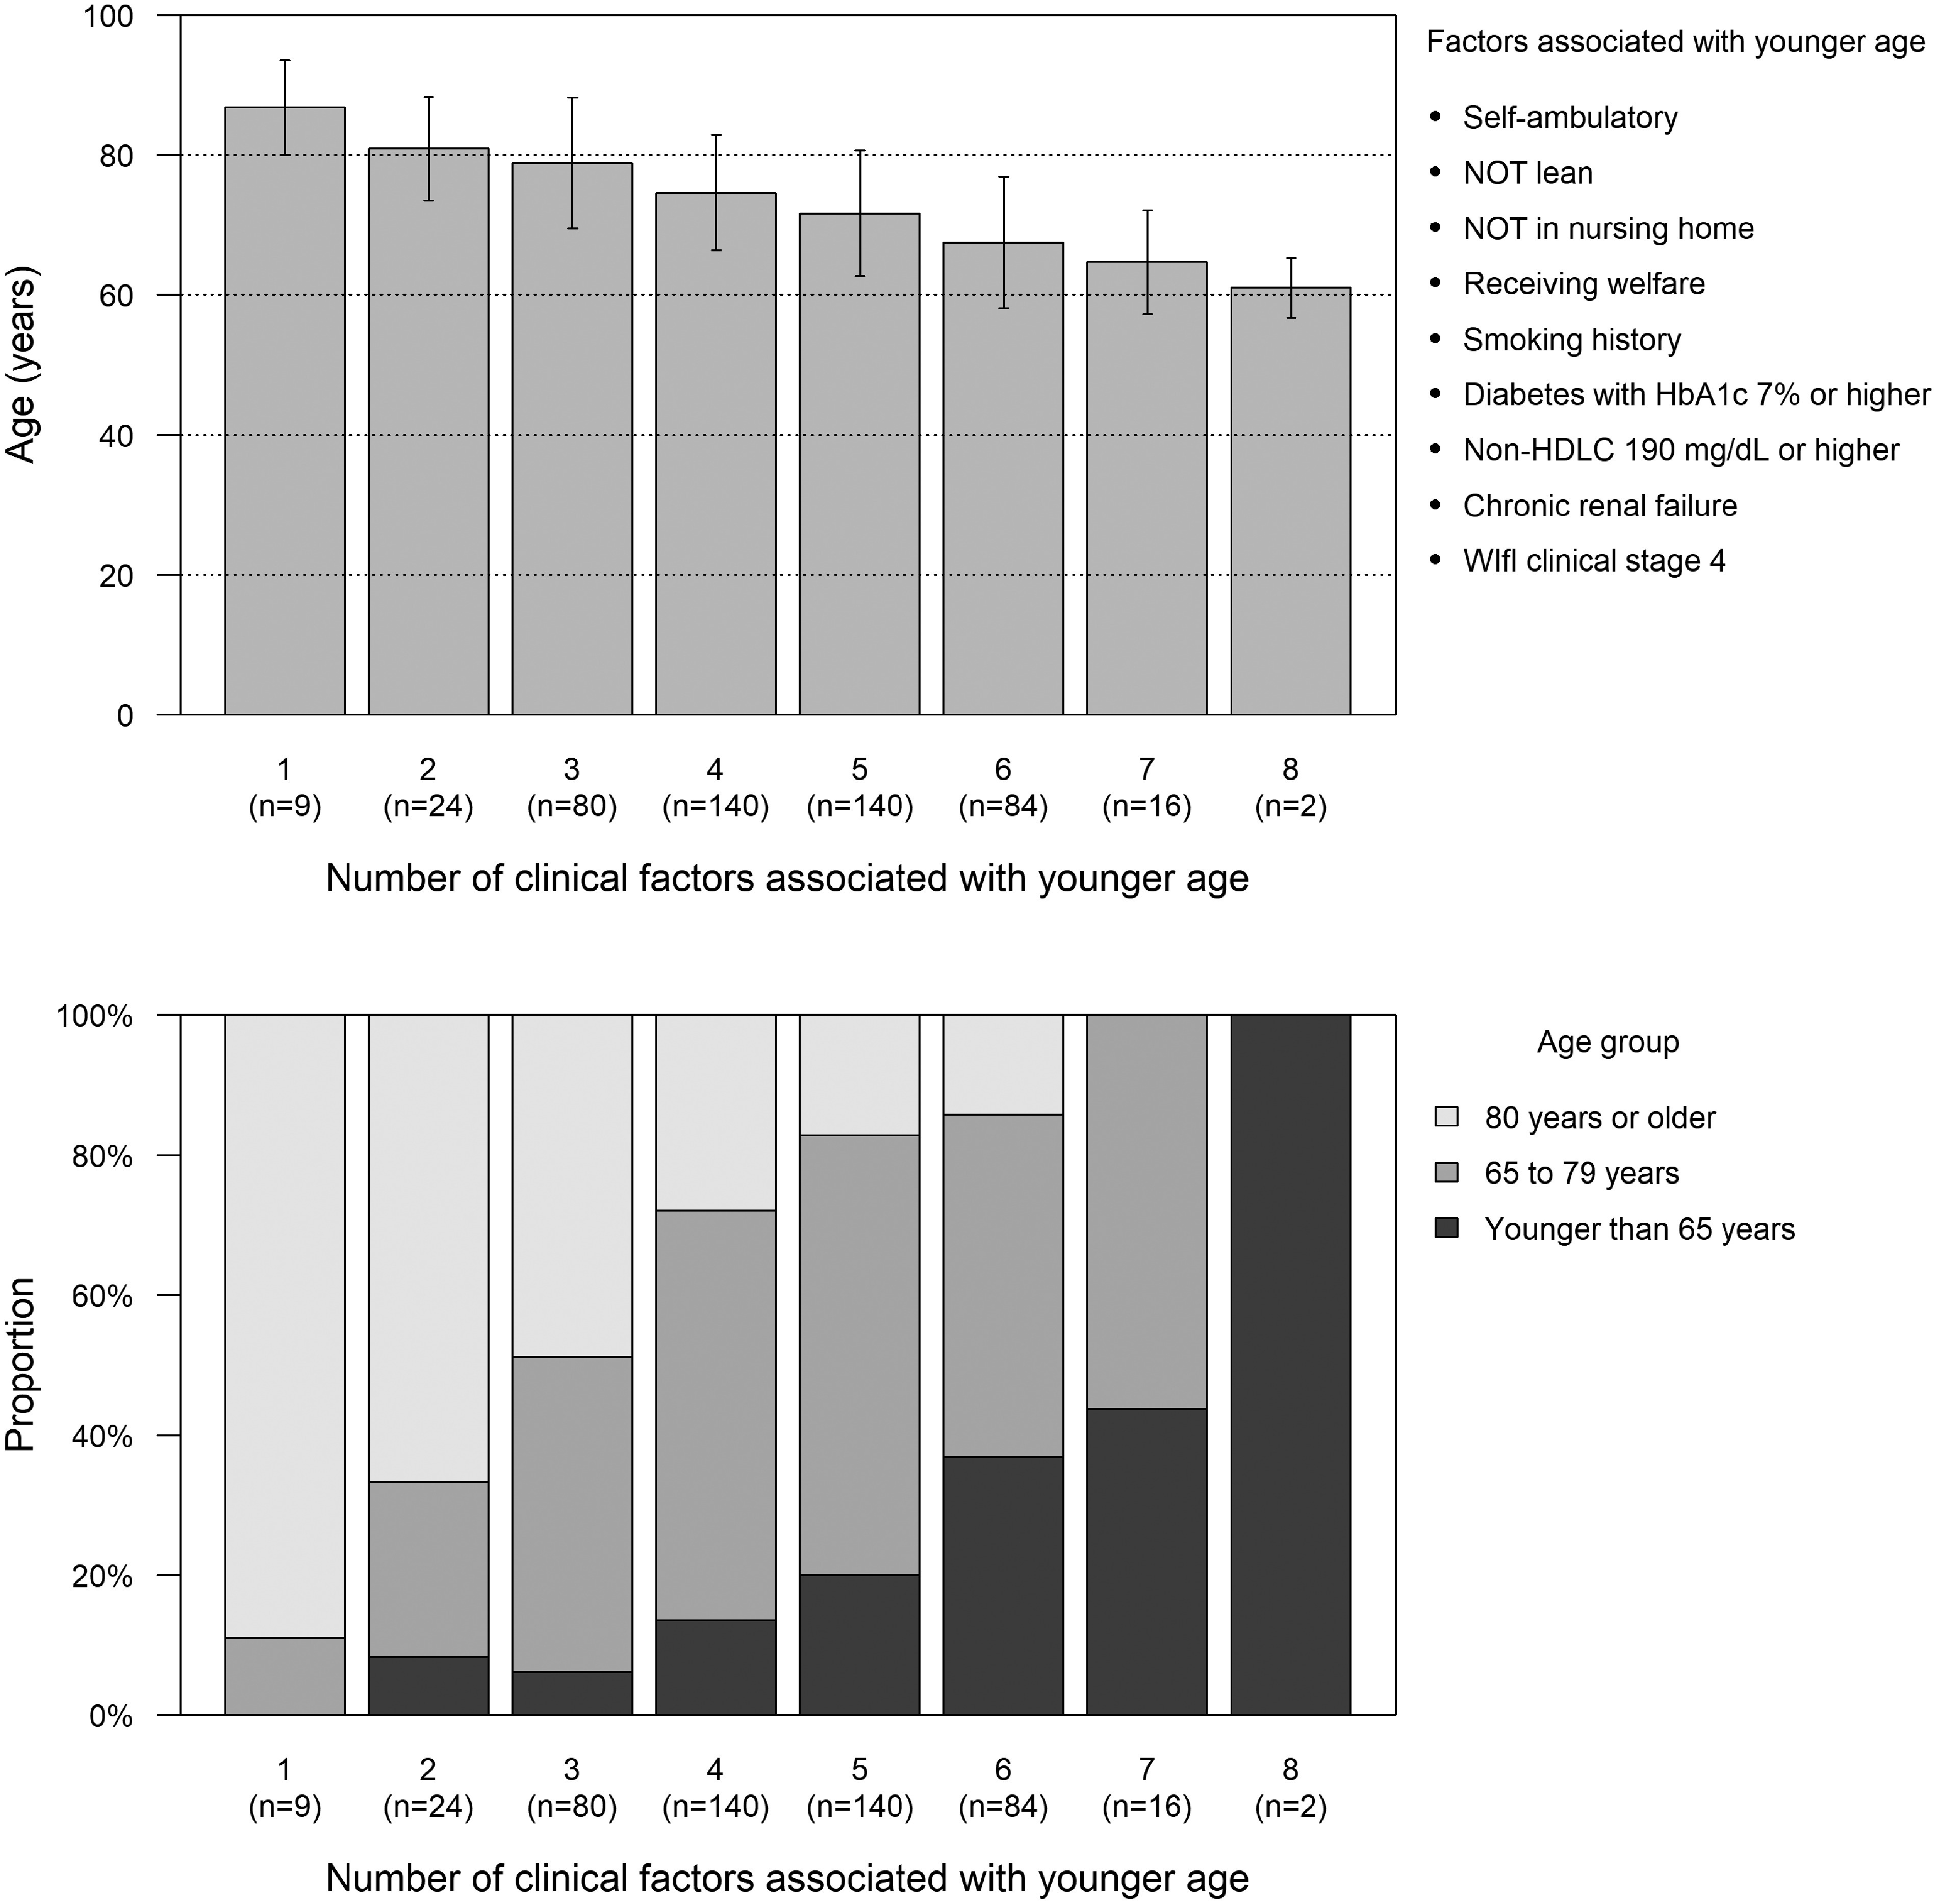
Fig. 3 Age by accumulation of clinical factors associated with younger age.
Data are means and standard deviations of age (upper panel) and the proportion of patients aged ≥80 years, 65 to 79 years, and <65 years (lower panel) in the subgroups of the CLI study population classified according to the number of clinical factors associated with younger age.