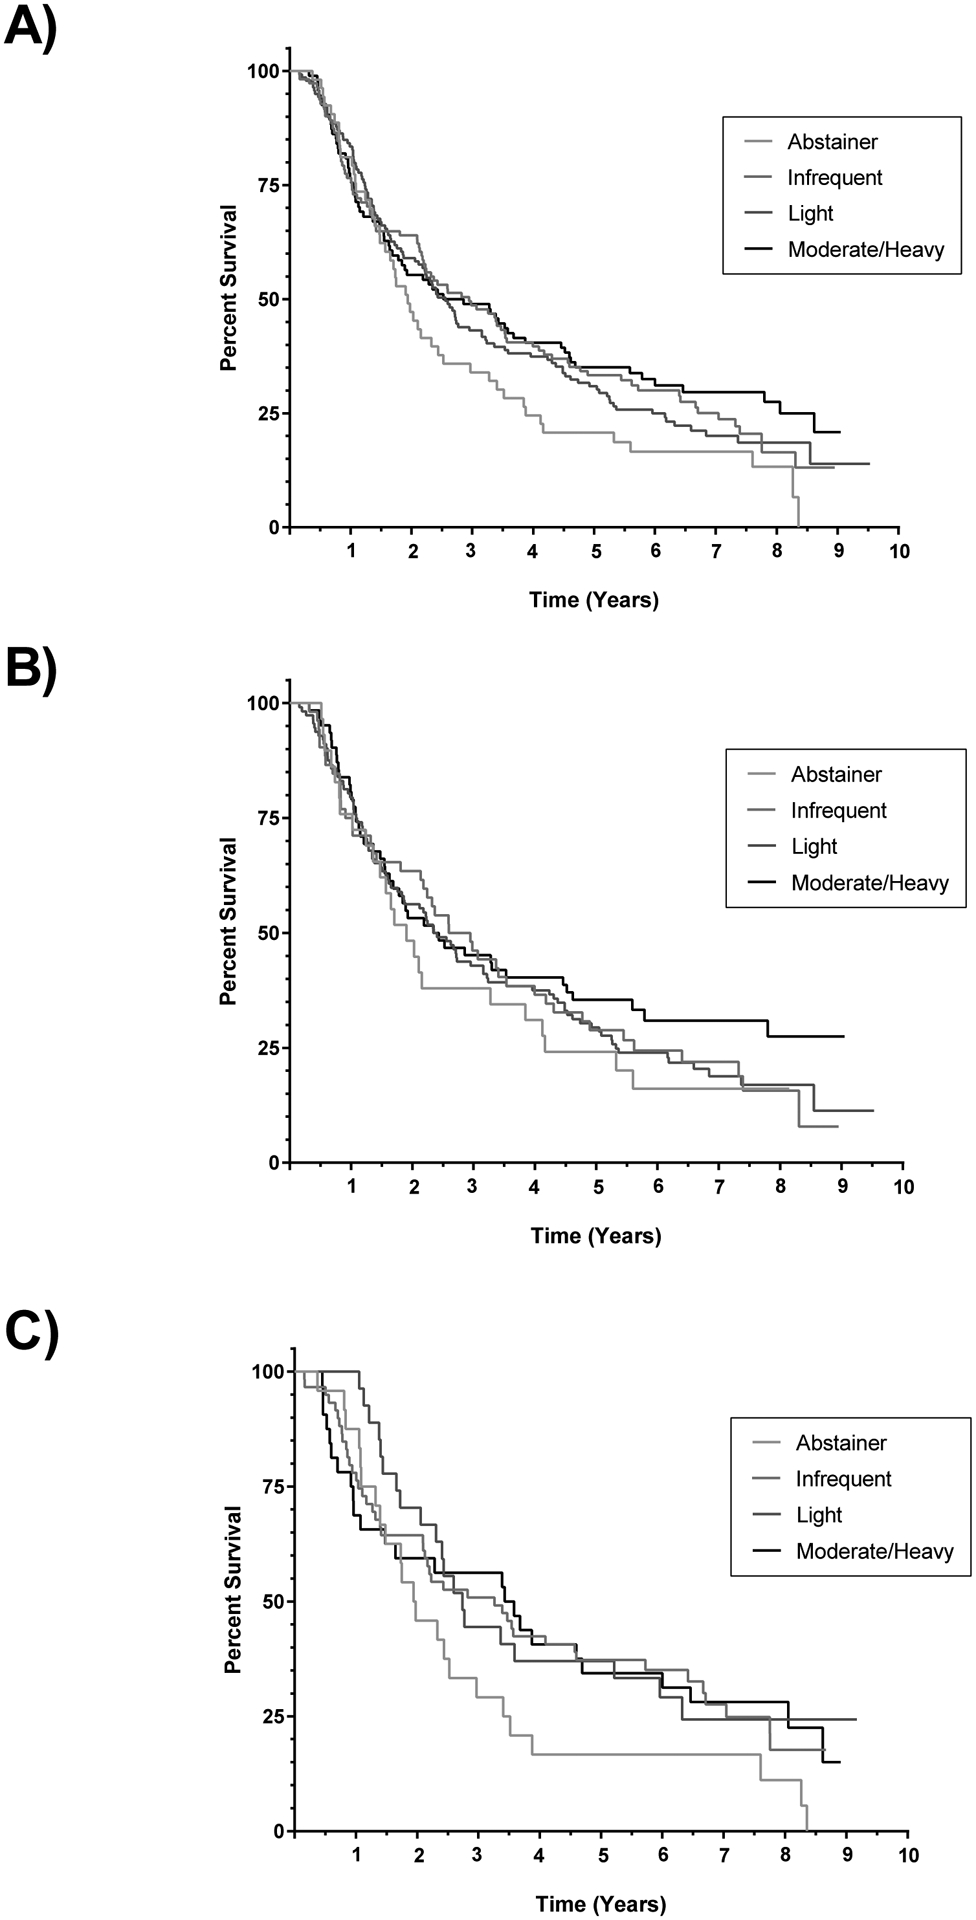
Figure 1.

Kaplan-Meier survival curves comparing survival by category of lifetime alcohol consumption. + denotes censored. A) Comparison of survival in males and females combined. Log-rank p-value = 0.19. B) Comparison of survival in males. Log-rank p-value = 0.53. C) Comparison of survival in females. Log-rank p-value = 0.24.
