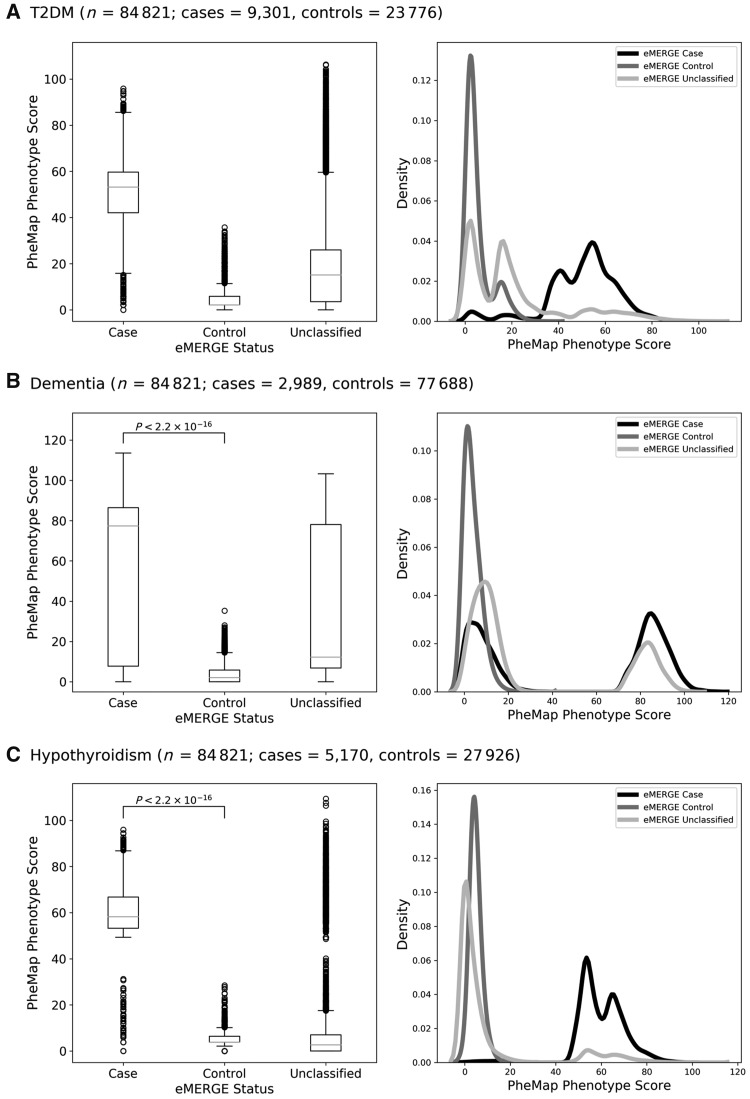
Figure 2.
PheMap phenotype score distributions of (A) T2DM, (B) dementia, and (C) hypothyroidism as box plots (left) and density plots (right), stratified by case-control status defined with clinician-validated eMERGE phenotyping algorithms. For each box plot, the band indicates the median, the boxes indicate the IQR, and the whiskers indicate the minimum and maximum values within 1.5 × IQR from the first and third quartiles, respectively. The circles indicate individual outlier values. eMERGE: Electronic Medical Records and Genomics; IQR: interquartile range; T2DM: type 2 diabetes mellitus.

