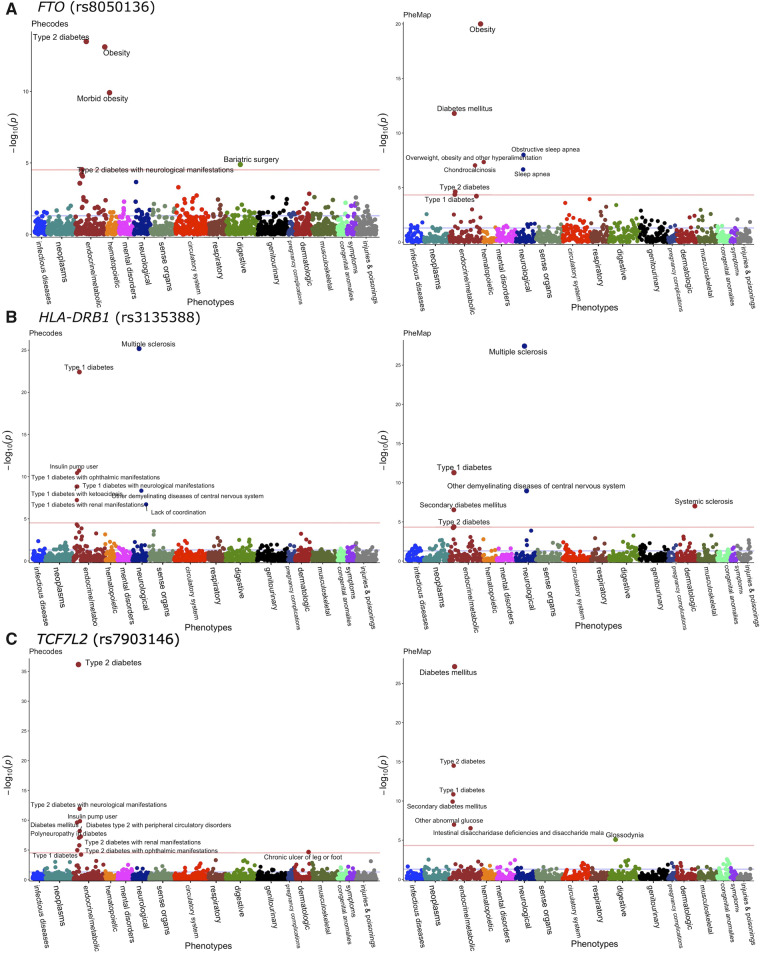
Figure 4.
Manhattan plots of phenome-wide association analyses with phecodes (left) and PheMap phenotype probability (right) in (A) FTO (rs8050136), (B) HLA-DRB1 (rs3135388), and (C) TCF7L2 (rs7903146). The red lines on Manhattan plots show the Bonferroni level of significance (5.0 × 10⁻⁵). Only phenotypes that cross the Bonferroni level of significance are annotated.

