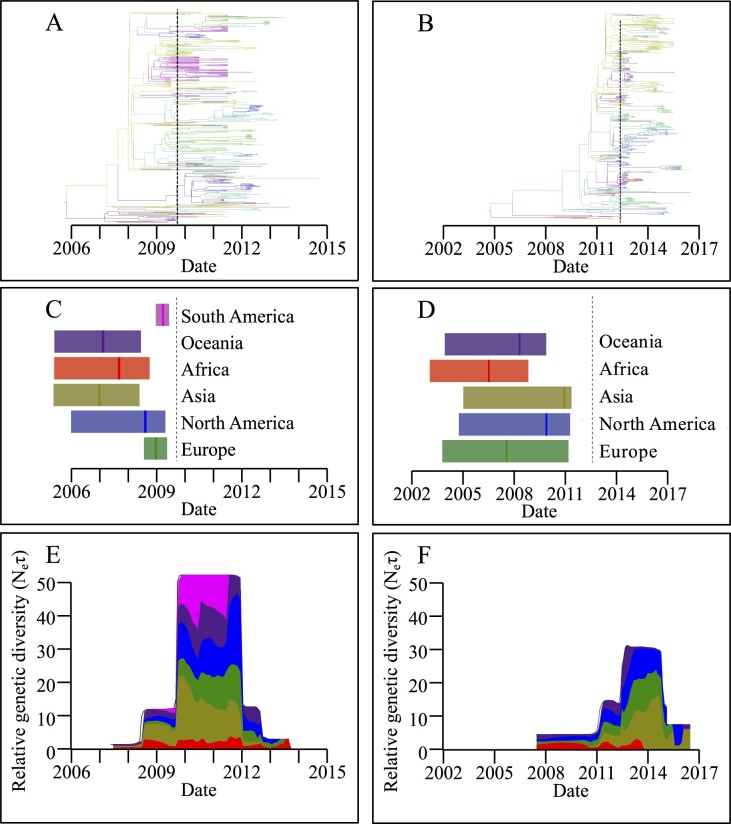
Figure 2.
GII.4 variants New Orleans 2009 and Sydney 2012 diversified and spread widely prior to pandemic emergence. (A and B) Spatiotemporally resolved MCC trees for New Orleans 2009 (A) and Sydney 2012 (B) with each branch colored by inferred location, as in panels C and D. (C and D) Summary of continent import dates for New Orleans 2009 (C) and Sydney 2012 (D); the vertical line is the median import date and the shaded area the 95 per cent HPD. The dashed vertical black line is the inferred date of pandemic emergence. (E and F) Summary of the spatiotemporal distribution of lineages from New Orleans 2009 (E) and Sydney 2012 (F). The proportion of lineages on each continent through time is plotted as a stacked area plot, scaled to the estimated relative genetic diversity.

