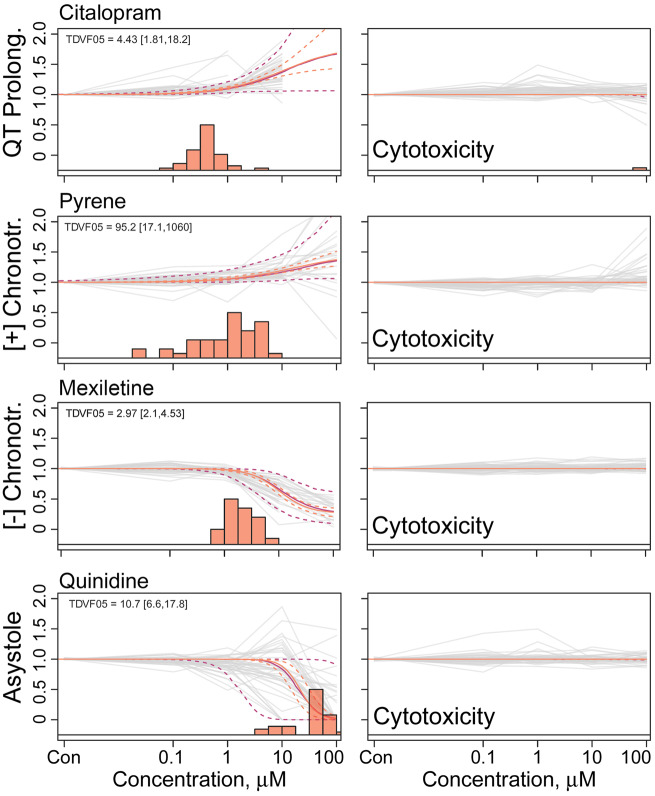
Figure 2.
Population concentration response modeling of representative compounds for each phenotype. All compounds shown are considered active for their respective functional endpoint. Orange and purple solid and dotted lines reflect the median estimate and 90% CI of the population median and the “random” individual, respectively. In vitro data for each donor is shown as a gray line. Histogram of median estimates for the 43 individuals’ point of departure is shown at the bottom of each plot. Each representative compound’s cytotoxicity concentration-response (C-R) is shown to the right of its C-R for one of the four other phenotypes.

