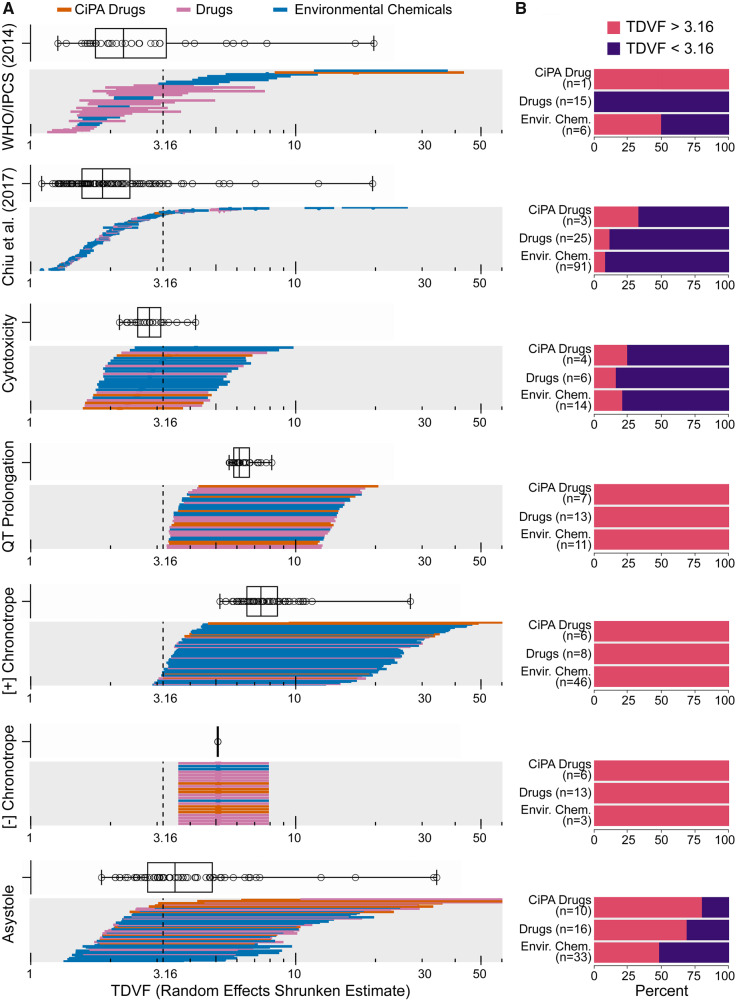
Figure 5.
Distribution of random effects derived shrunken TDVF05 estimates. A, Shrunken median estimate and 95% CI TDVF05 values separated by phenotype or study and color coded by chemical class. The vertical dotted line reflects the default uncertainty factor (UFH, TD = 3.16). The distribution of shrunken median estimate TDVF05 values is illustrated as the boxplot above each endpoint panel. B, Barplots showing the percentage of compounds by class whose shrunken median estimate TDVF05 value exceeds or falls below the default UFH, TD. Number of compounds reported in each class is the number of unique compounds, not accounting for multiple compound/endpoint combinations.

