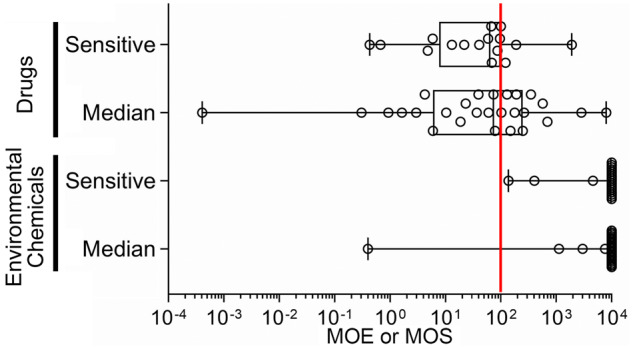
Figure 7.

Distribution of median and sensitive individual’s margins of safety (MOS)/margins of exposure (MOE). Box and whiskers plots show the range in MOE/MOS across tested compounds. Box is interquartile range, vertical line is the median, whiskers are min-max values. All individual data are shown as circles. Red vertical line indicates a MOS or MOE of 100.
