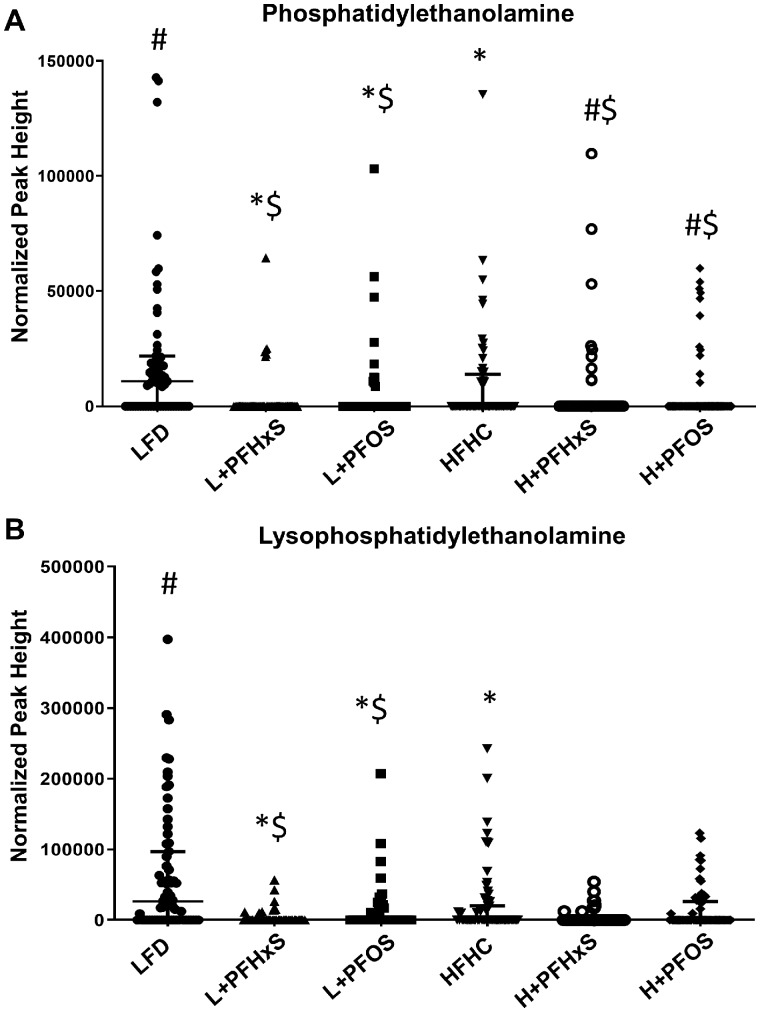
Figure 3.
Effect of PFOS and PFHxS on phosphatidylethanolamine (PE) levels within an LFD or HFHC diet. Data are indicative of 6 (n = 6) samples per group. Each symbol represents an individual lipid feature as identified by LC-MS/MS. Significance between treatment groups is denoted as follows *significant from the LFD control, #significant from the HFHC control, $significance between PFOS and PFHxS within each diet, and &significance between diet within each compound. Normalized peak areas between all cells are shown for (A) PC, (B) 14.0/22.0 PC, (C) OxPC, and (D) OxLPC. Each symbol represents an individual lipid feature as identified by LC-MS/MS.

