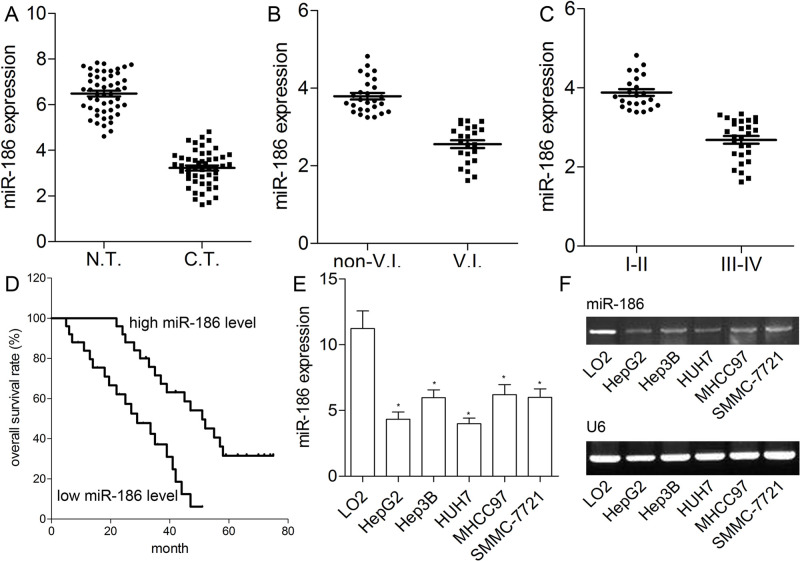
Figure 1.
Expression of miR-186 in hepatocellular carcinoma (HCC) tissues and cell lines. (A) Quantitative reverse transcriptase polymerase chain reaction (qRT-PCR) analysis for the relative expression of miR-186 in 50 cases of HCC tissues and adjacent normal tissues. (B) The expression of miR-186 in HCC with (n = 23) or without vascular invasion (V.I.) (n = 27). (C) The expression of miR-186 in HCC with low (I–II) (n = 23) and high TNM stage (III–IV) (n = 27). Data represent means ± standard deviation (SD) of three independent experiments. (D) Kaplan–Meier survival curves for patients with high and low miR-186 expression are shown. (E) The qRT-PCR was used to quantitatively detect miR-186 expression in HCC cells. (F) RT-PCR bands for miR-186 and U6 in HCC cell lines are shown. Data represent means ± standard error of the mean (SEM) of three independent experiments. *p < 0.01.

